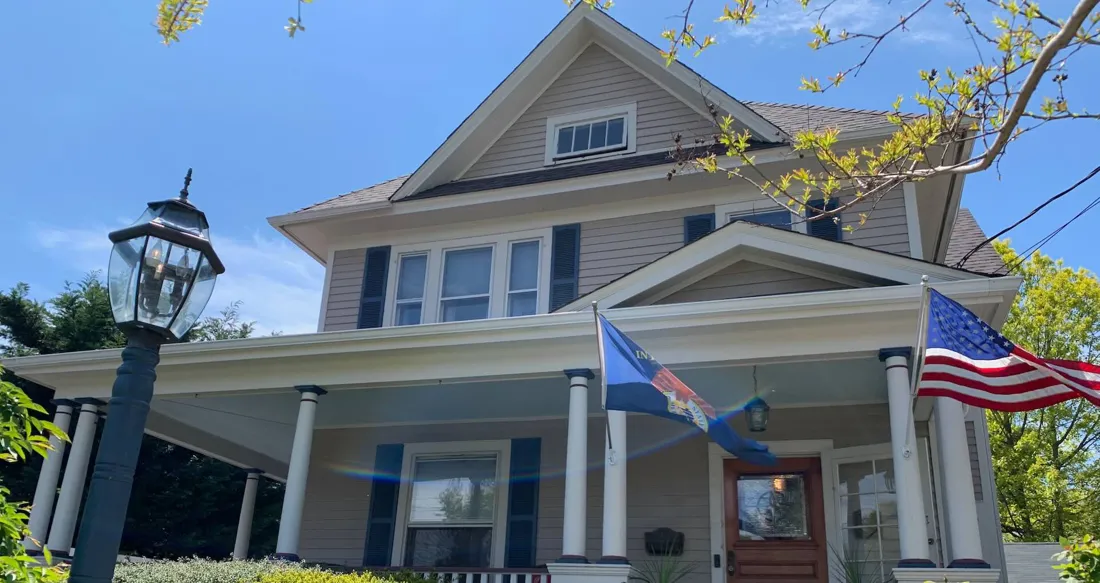
Welcome to the Educators Realty Blog, your trusted source for expert real estate insights across Long Island, Nassau, Queens, and Suffolk County. We cut through the noise with data-driven market updates, essential guides for first-time buyers, and reliable strategies for selling your home. Get the educational edge you need to master the Long Island housing market.

Oct. 30, 2026

Final Walkthrough Checklist for Long Island Home Sellers | Educators Realty

A little preparation before the final walkthrough can save Long Island sellers real money at closing.

The final walkthrough usually happens a day or two before closing. It's the buyer's chance to confirm the home is in the condition promised in the contract, that agreed items are still there, and that everything else is gone.

Most walkthroughs go smoothly. But when a problem turns up at the last minute, the seller has very little time to fix it. Small issues that could have been handled for a few dollars can turn into credits or price reductions at the closing table.

The most common walkthrough issues

In our experience, and from conversations with other local brokers, the same four issues come up again and again:

  • "Broom clean" disagreements. The seller thinks the house is clean; the buyer doesn't.
  • Items left behind. An old refrigerator in the garage, boxes in the attic, or paint cans and spare tiles the seller thought would be helpful.
  • Missing fixtures. Shades, blinds, curtains or light fixtures the buyer expected to stay.
  • Damage questions. A problem the buyer says wasn't there at the home inspection.

Five tips for a smooth walkthrough

  1. Go beyond "broom clean." Sweeping is the minimum. Wipe down the refrigerator inside and out, the countertops and the bathrooms. Vacuum crumbs and debris out of kitchen and bathroom cabinets and drawers. Leave the house completely empty, including the garage, attic, basement and any sheds, unless something has been agreed to in writing.
  2. Don't assume the buyer wants your extras. Spare tiles, leftover paint or a second fridge may seem like a helpful gift, but to many buyers they're just something to haul away. If you'd like to leave anything behind, ask your agent to confirm it with the buyer's agent first. If the buyer says no, it goes.
  3. Decide on fixtures when you list. If you plan to take shades, blinds, curtains, a chandelier or anything else attached to the house, tell your agent at the start. Your attorney can then list those exclusions in the contract, so there's no confusion later.
  4. Schedule the walkthrough the night before closing. A walkthrough the morning of closing leaves no time to fix anything. The night before gives everyone a chance to raise concerns right away and resolve small issues that evening, instead of at the closing table.
  5. Leave everything working. Keep the utilities on through closing, and check that appliances, faucets, lights and heating or cooling all run before you hand over the keys.

If a question comes up about damage

Sometimes a buyer notices something at the walkthrough and believes it's new. Often there's a simple way to check.

  • The home inspection report. The buyer's own inspector documented the home's condition, usually with photos. If the issue is in the report, it was there before the contract was signed.
  • The listing photos. Many defects, like a missing gutter or a damaged fence, are visible in the photos taken when the home went on the market.

On Long Island, real estate attorneys handle the contract and the closing, so they'll work out anything still unresolved. But checking the facts early usually settles the question quickly and fairly for both sides.

Frequently asked questions

When does the final walkthrough happen on Long Island?

Usually within 24 to 48 hours before closing. We recommend scheduling it the evening before closing, so there's time to fix small issues.

What does "broom clean" mean when selling a house?

At a minimum, the home is empty of belongings and debris and the floors are swept. We recommend going further: wipe down the refrigerator, countertops and bathrooms, and vacuum out cabinets and drawers.

Should I leave leftover paint and spare tiles for the buyer?

Only if the buyer agrees ahead of time. Otherwise, remove them along with everything else.

Are shades, blinds and curtains included in a home sale?

It depends on your contract. Items attached to the home are often treated as part of the sale, so if you plan to take them, have your attorney list them as exclusions in the contract.

What happens if the buyer finds a problem at the walkthrough?

Many issues can be fixed before closing. If something is still unresolved, the buyer's and seller's attorneys will work it out, often with a repair, a credit or money held in escrow until it's fixed.

A smooth closing starts at listing

A great sale doesn't end when you accept an offer. At Educators Realty, we guide our sellers through every step, from the day the home is listed to the moment the keys change hands, so there are fewer surprises at the closing table.

Thinking about selling your Long Island home? Contact Educators Realty to talk with one of our agents.


About the author: [Your name] is the broker and owner of Educators Realty in Syosset, NY, and teaches the New York State Real Estate Salesperson course at Molloy University.

Oct. 27, 2026

Development Watch: The Long Fight Over the Elwood Site on Jericho Turnpike

Updated October 27, 2026

If you've driven east on Jericho Turnpike past Manor Road in Elwood, you've passed it: roughly 55 acres of wooded, hilly land that once held the Mediavilla apple orchard. For decades, developers have tried to build there, and for decades, the plans have stalled.

The latest proposal, called Estates at Elwood, would put 46 single-family homes on the site. It is still before the Town of Huntington Planning Board, with no decision yet. Here's what's planned, where it stands, and how we got here.

What's proposed

The applicant, Villadom Corp., wants to build 46 single-family homes on the 55-acre site and hold the southwest corner for possible future commercial use. The land is already zoned R-40, which allows single-family homes on large lots, so no rezoning is needed this time.

The key details:

  • Clustered homes, preserved woods. The town previously accepted a conventional yield of 54 lots. Villadom proposes 46, mostly on lots of about 21,000 to 41,400 square feet, with two larger lots along Jericho Turnpike. Clustering frees up about 20.8 acres of mostly wooded land in the northwest corner to stay preserved.
  • One way in and out. All traffic would use a single entrance on Jericho Turnpike, about 900 feet east of Old Country Road, with new turn lanes and acceleration and deceleration lanes on Jericho.
  • Drainage. A 1.83-acre groundwater recharge basin is planned along Jericho in the south-central part of the property.
  • A park next door. The site borders Berkeley Jackson County Park.
About 21 of the 55 acres would stay wooded Estates at Elwood site plan, simplified. Not to scale; boundaries approximate. Site: about 55 acres, zoned R-40 Manor Road Warner Road Jericho Turnpike (Route 25) Preserved woods about 20.8 acres Possible future commercial 46 single-family homes clustered lots location approximate Recharge basin 1.83 acres Single entrance with turn lanes about 900 ft east of Old Country Road N The site also borders Berkeley Jackson County Park (side not shown).
The woods stay in the northwest, a commercial pad sits in the southwest, and every car enters through one driveway off Jericho. Simplified from public descriptions; not an official site plan.

See it on the map:

Where it stands

The Planning Board held a public hearing on August 5, 2026, and kept the hearing open without a vote. As of this writing, we have not found a decision.

At the hearing, residents and board members raised questions about:

  • Water capacity
  • Relying on a single entrance on Jericho Turnpike, and emergency access
  • Steep slopes and wildlife
  • How the open space would be protected long term

Reaction was mixed. Some residents objected to added traffic on Jericho, while at least one speaker supported the cluster approach because it leaves a large part of the property undeveloped. The developer's engineer said a full traffic analysis was done and pointed to the planned turn lanes.

Suffolk County planners have also weighed in. They recommended permanent legal protection for the open space, Health Department review, confirmation of public-water capacity, a natural buffer along Berkeley Jackson County Park, state approval for work on Jericho Turnpike (a state road), and an alternate route for emergency vehicles.

How we got here

This site has drawn development proposals for more than four decades, according to the project's engineer. Each plan has looked different, and each has met resistance. The most recent chapters:

When Proposal What happened
2026 Estates at Elwood: 46 single-family homes, about 20.8 acres preserved Public hearing Aug. 5; left open, no vote yet
Late 2025 Earlier Estates at Elwood plan: 44 homes on about 0.4-acre lots, preserved space, small commercial area Introduced to the Planning Board; later revised to 46 homes
2022 Country Pointe Elwood (Beechwood Organization): 385 townhomes for residents 55 and over Did not move forward
2018 Elwood Orchard (Villadom): about 486,000 sq. ft. commercial development, requiring a rezoning from R-40 to commercial Hundreds of residents opposed it; the rezoning request was withdrawn in May 2018

The big difference now: earlier plans needed a zoning change or leaned heavily commercial. This one fits the existing residential zoning, which gives the town less room to simply say no and shifts the debate to traffic, water and environmental conditions.

Why it matters, and what to watch

Elwood isn't Syosset, but Jericho Turnpike ties our communities together. Large projects along the corridor shape traffic, local inventory and how buyers compare towns across the Nassau-Suffolk line. And a 46-home subdivision would add a meaningful batch of new-construction single-family homes to the area.

What to watch next:

  • The Planning Board's next step on the open hearing and the cluster request
  • Conditions tied to any approval, especially on traffic, water and the preserved open space
  • State review of the proposed changes to Jericho Turnpike

Want to follow along? Planning Board agendas, meeting videos and project documents are posted on the Town of Huntington website. Meetings are open to the public, and residents can speak during public hearings.

We'll update this post as the project moves forward.

Sources


This post is for general information about local development and is not legal or investment advice. Details are based on public reporting as of the date above and may change. Educators Realty, Syosset, NY. Equal Housing Opportunity.

Oct. 25, 2026

Uniondale, NY Real Estate Market Report: November 2026

Your monthly look at Uniondale home prices, inventory and recent sales, using September 2026 data from Realtors Property Resource® (RPR) and a 12-month review of OneKey® MLS closed sales.

If you are buying or selling a home in Uniondale this fall, the September 2026 numbers point to a market that is still firmly tilted toward sellers. RPR classifies Uniondale as a seller’s market: there were just 2.22 months of inventory, the median sold price rose to $640,000, and the typical home closed at 102.6% of its list price. At the same time, the homes that closed in September had spent longer on the market than in August, so not every listing is moving at the same speed.

Uniondale is a small market, so a handful of sales can swing the monthly figures. That is why this report also includes a 12-month look at 85 closed sales alongside RPR’s monthly data. Below, we break down what the numbers mean for buyers and sellers and feature 20 recently sold homes from across Uniondale — including sales on Northern Parkway, Southern Parkway, Barry Place, Henry Street and Warwick Street.

Uniondale Market at a Glance (September 2026)

Median Sold Price

$640,000

↑ 12.3% month over month

Months of Inventory

2.22

↓ 36.6% MoM • ↓ 31.7% over 12 months

Sold-to-List Price

102.6%

↑ 5.6% month over month

Median Days (Sold)

64

↑ 88.2% month over month

Median Est. Value

$662,450

↑ 2.1% MoM • ↑ 4.2% over 12 months

Homes Sold

11

↑ 57.1% month over month

Property types: SF + Condo/TH/Apt. Source: Realtors Property Resource®, LLC, report dated October 25, 2026.

Uniondale Market Type (RPR, September 2026)

▼    
     
Seller’s Market Balanced Buyer’s Market

Source: Realtors Property Resource®, LLC – September 2026, SF + Condo/TH/Apt.

What Changed From August to September 2026

Median sold price
▲ +12.3%
Homes sold
▲ +57.1%
Active listings
▼ -28.6%
New listings
▼ -7.7%
Months of supply
▼ -36.6%
Median days (sold)
▲ +88.2%
Sold $/sq ft
▲ +27.4%
Median est. value
▲ +2.1%

Increase    Decrease  •  Bar length shows size of change

Source: Realtors Property Resource®, LLC – September 2026, SF + Condo/TH/Apt.

What the September 2026 Numbers Mean for Uniondale

Home prices: a strong month and a steady 12-month trend

The median sold price in Uniondale was $640,000 in September, up 12.3% from August. With only 11 sales in the month, that jump partly reflects which homes happened to close, so it helps to look at the broader value picture as well. RPR’s median estimated property value for Uniondale stands at $662,450, up 2.1% month over month and up 4.2% over the past 12 months. That longer trend is usually a better gauge of where homeowner equity is heading than any single month of closings.

Median Price by Market Stage

New listings
$745K
Active
$730K
New pending
$679K
All pending
$679K
Sold
$640K

Source: Realtors Property Resource®, LLC – September 2026, SF + Condo/TH/Apt.

Inventory: very tight, and tighter than last month

Uniondale had 2.22 months of inventory in September, down 36.6% from the prior month and down 31.7% from a year earlier. In practical terms, if no new homes came to market, the current supply would sell out in a little over two months — well within the range generally associated with sellers holding the advantage. There were 20 active listings (down 28.6% month over month) with a median list price of $729.5K, and 12 new listings came to market during the month (down 7.7%) at a median list price of $745K.

Number of Properties by Market Stage

New listings
12
Active
20
New pending
14
All pending
32
Sold
11

Source: Realtors Property Resource®, LLC – September 2026, SF + Condo/TH/Apt.

Days on market: closed sales took longer, new contracts came faster

Homes that sold in September had a median of 64 days in RPR, up 88.2% from August. Earlier in the pipeline the picture is quicker: the full pending pool showed a median of 26 days (down 39.5%), and new pending listings went under contract in a median of 30 days (up 3.4%). Active listings showed a median of 36 days. In short, several of September’s closings had been on the market for a while, but homes going under contract now are moving at a brisker pace.

Median Days in RPR by Market Stage

Sold
64 days
New pending
30 days
All pending
26 days
Active
36 days

Source: Realtors Property Resource®, LLC – September 2026, SF + Condo/TH/Apt.

Price per square foot and home size

Sold homes closed at a median of $576 per square foot, up 27.4% month over month. Active listings are asking a median of $468 per square foot (down 6.8%) for a median of 1,600 square feet of living area, while new listings came in at $464 per square foot and a median of 1,552 square feet. The gap between sold and active price per foot is another sign that September’s small group of closings leaned toward homes that commanded strong prices for their size.

Median Price per Square Foot by Market Stage

New listings
$464
Active
$468
New pending
$521
All pending
$506
Sold
$576

Source: Realtors Property Resource®, LLC – September 2026, SF + Condo/TH/Apt.

Sales activity and pending contracts

A total of 11 homes sold in September, up 57.1% from August, for a total dollar volume of $7.43 million (up 71%). Looking ahead, 14 new pending listings (up 16.7%) and 32 total pending listings (up 14.3%) suggest a healthy flow of closings in the coming weeks. The median list price of pending homes was $679K, up 3.3%. RPR’s public-records sales section did not have enough activity in Uniondale this month to report, so the figures above come from listing data.

Uniondale – September 2026, SF + Condo/TH/Apt. Source: Realtors Property Resource®, LLC. Changes are month over month.
Category # of Properties Median Price Median $/Sq Ft Median Days Total $ Volume
Sold 11 (↑57.1%) $640K sold (↑12.3%) $576 (↑27.4%) 64 (↑88.2%) $7.43M (↑71%)
Active 20 (↓28.6%) $730K list (↑5.1%) $468 (↓6.8%) 36 (↑9.1%) $14.81M (↓24.5%)
New Listings 12 (↓7.7%) $745K list (↑3.6%) $464 (0%) — $8.9M (↓4.1%)
New Pending 14 (↑16.7%) $679K list (↓1.5%) $521 (↓9.1%) 30 (↑3.4%) $9.82M (↑24.4%)
All Pending 32 (↑14.3%) $679K list (↑3.3%) $506 (↑0.2%) 26 (↓39.5%) $21.65M (↑17.6%)

Uniondale Closed Sales Snapshot (Nov 2025 – Oct 2026)

To smooth out the month-to-month swings in a small market, we also looked at 85 closed sales recorded in OneKey® MLS between November 3, 2025 and October 23, 2026. Over that 12-month period the median sold price was $688,000, with sales ranging from $450,000 to $1,257,000. Most of the activity sat in the middle of the market: 36 sales closed between $600,000 and $699,999 and 30 between $700,000 and $799,999. The median home closed at 101.3% of its original list price after a median of 34 days on market.

These 12-month figures differ from RPR’s September snapshot (for example, a $688,000 median versus $640,000) because they cover a full year of sales rather than a single month. Both are accurate for their own scope. For buyers, the 12-month data shows where most Uniondale homes actually trade; for sellers, it confirms that homes have consistently sold close to or above their asking prices over the past year.

Closed Sales

85

Median Sold Price

$688,000

Average Sold Price

$688,385

Median Days on Market

34

Median $/Sq Ft

$517

Median Sold-to-List

101.3%

Sold prices ranged from $450,000 to $1,257,000. Source: OneKey MLS closed sales report, Nov 3, 2025 – Oct 23, 2026. Calculated by Educators Realty from 85 closed sales; information not guaranteed.

Closed Sales by Price Range

Under $600K
13
$600K–$699K
36
$700K–$799K
30
$800K and up
6

Source: OneKey MLS closed sales report, Nov 3, 2025 – Oct 23, 2026. Calculated by Educators Realty from 85 closed sales; information not guaranteed.

What This Market Means for Uniondale Buyers

  • Expect competition on well-priced homes. With sold homes closing at a median of 102.6% of list price in September, buyers should be prepared for offers at or above asking on the most appealing listings.
  • Have financing ready before you shop. Only 20 homes were active in September and inventory fell 36.6% in a month, so a mortgage pre-approval helps you act quickly when the right home appears.
  • Focus on the $600K–$799K range. Over the past 12 months, 66 of 85 Uniondale closings fell in this band, so that is where you will see the most choice and the most comparable sales.
  • Review recent comparables before offering. Active listings carry a $729.5K median list price, above September’s $640,000 median sold price. Recent sales are the best guide to where a specific home is likely to trade.

What This Market Means for Uniondale Sellers

  • Conditions favor sellers. RPR rates Uniondale a seller’s market, and just 2.22 months of supply keeps buyers competing for a small number of homes.
  • Equity has grown. The median estimated value is $662,450, up 4.2% over the past 12 months. A current home valuation can show what that means for your property.
  • Pricing still matters. September’s sold homes had a median of 64 days in RPR, up sharply from August. Homes priced in line with recent sales tend to go under contract faster.
  • Low competition from other listings. With active listings down 28.6% month over month, a well-prepared home can stand out this season.

Where Homes Sold: Price Ranges Across Uniondale

The 20 recent sales featured below come from 17 different Uniondale streets and span the full range of recent prices, from $468,000 to $1,257,000:

  • Under $600,000 (5 homes): sales on Sterling Street, Windsor Road, Hill Street, Barry Place and Uniondale Avenue, from $468,000 to $585,000.
  • $600,000–$699,999 (5 homes): California Avenue, Fullerton Avenue, Henry Street, Clarendon Road and Northern Parkway — the band that includes September’s $640,000 median sold price.
  • $700,000–$799,999 (5 homes): Henry Street, Decatur Street, Northern Parkway, New Street and Southern Parkway.
  • $800,000 and above (5 homes): Gilroy Avenue, Northgate Court, Barry Place, Clinton Avenue and a $1,257,000 sale on Warwick Street.

The featured homes range from 2 to 9 bedrooms and from 1 to 5 baths. These sales are a sample chosen to show the range of recent activity, not a statistical summary — for town-wide figures, refer to the RPR data and the 12-month closed sales snapshot above.

Recently Sold in Uniondale, NY

Below are 20 homes that recently sold in Uniondale. Click any address, photo or button to view full property details on educatorsrealty.com.

Uniondale Real Estate FAQs

Is Uniondale, NY a buyer's or seller's market right now?

Based on September 2026 data from Realtors Property Resource (RPR), Uniondale is classified as a seller's market, with 2.22 months of inventory and homes selling at a median of 102.6% of list price.

What is the median sold price of a home in Uniondale?

The median sold price for single-family homes, condos, townhouses and apartments in Uniondale was $640,000 in September 2026, up 12.3% from the prior month, according to RPR. The median estimated property value was $662,450, up 4.2% over 12 months.

How fast are homes selling in Uniondale?

Homes that sold in September 2026 had a median of 64 days in RPR, up 88.2% month over month. Pending listings showed a median of 26 days, down 39.5%, and active listings a median of 36 days.

How many homes are for sale in Uniondale?

RPR reported 20 active listings in Uniondale for September 2026, down 28.6% month over month, with 12 new listings coming to market during the month.

What is the price per square foot in Uniondale?

Sold homes in September 2026 had a median of $576 per square foot, up 27.4% month over month. Active listings had a median of $468 per square foot.

Thinking About Buying or Selling in Uniondale?

Educators Realty is a boutique brokerage based in Syosset serving buyers and sellers in Uniondale and throughout Nassau County and Long Island. Whether you want to ask about one of the homes above, schedule a private showing, request more recent sales on a particular street, refine your home search, or find out what your home could sell for in today’s market, we’re here to help.

Your AgentRamona McGuire
Licensed Real Estate Salesperson
(718) 306-2372
rmac@educatorsrealty.com
BrokerageEducators Realty
332 Jackson Ave, Syosset, NY 11791
(516) 517-2400
educatorsrealty.com
Call (718) 306-2372 Get a Home Valuation Search Uniondale Homes

By:
Ramona McGuire
Licensed Real Estate Salesperson
(718) 306-2372
rmac@educatorsrealty.com

Market statistics: Realtors Property Resource®, LLC, Uniondale, NY Market Trends, September 2026 (SF + Condo/TH/Apt), retrieved October 25, 2026. Information is not guaranteed.

Listings courtesy of OneKey® MLS as distributed by MLS GRID. Based on information submitted to the MLS GRID as of 2026-10-25 at 3:23 pm. All data is obtained from various sources and may not have been verified by broker or MLS GRID. All information should be independently reviewed and verified for accuracy. Properties may or may not be listed by the office/agent presenting the information.

Educators Realty, Inc., 332 Jackson Ave, Syosset, NY 11791. Equal Housing Opportunity. We are pledged to the letter and spirit of federal and New York State fair housing laws. NYS Fair Housing Notice.

Posted in Ramona's Blog
Oct. 24, 2026

Jericho, NY Real Estate Market Report: November 2026

Your monthly look at Jericho home prices, inventory and recent sales, using September 2026 data from Realtors Property Resource® (RPR) and OneKey® MLS.

If you are buying or selling a home in Jericho this fall, the September 2026 numbers point to a market that is still priced firmly but is giving buyers more choice than it did a year ago. RPR continues to classify Jericho as a seller’s market, and the median sold price rose to $1,225,000, up 5.2% from August. Homes that sold also moved faster, with a median of 33 days in RPR. At the same time, supply has grown noticeably: Jericho had 4.5 months of inventory, up 71.8% over the past 12 months, and the typical home closed at about 97% of its list price rather than above it.

For buyers, that combination means more homes to compare and more room to negotiate on price than in recent seasons. For sellers, it means demand is still there, but pricing in line with recent sales matters. Below, we break down what the September data shows, add a 12-month look at Jericho closed sales from OneKey® MLS, and feature 20 recently sold homes — from Manors Drive and Halsey Avenue to Saint Lawrence Place and Holiday Pond Road.

Jericho Market at a Glance (September 2026)

Median Sold Price

$1,225,000

↑ 5.2% month over month

Months of Inventory

4.5

↑ 3.2% MoM • ↑ 71.8% over 12 months

Sold-to-List Price

96.99%

↑ 0.2% month over month

Median Days (Sold)

33

↓ 13.2% month over month

Median Est. Value

$1,365,840

↓ 0.1% MoM • ↑ 4.1% over 12 months

Homes Sold

14

↑ 7.7% month over month

Property types: SF + Condo/TH/Apt. Source: Realtors Property Resource®, LLC, report dated October 24, 2026.

Jericho Market Type (RPR, September 2026)

▼    
     
Seller’s Market Balanced Buyer’s Market

Source: Realtors Property Resource®, LLC – September 2026, SF + Condo/TH/Apt.

What Changed From August to September 2026

Median sold price
▲ +5.2%
Homes sold
▲ +7.7%
Active listings
▼ -6.3%
New listings
▲ +0%
Months of supply
▲ +3.2%
Median days (sold)
▼ -13.2%
Sold $/sq ft
▲ +14.2%
Median est. value
▼ -0.1%

Increase    Decrease  •  Bar length shows size of change

Source: Realtors Property Resource®, LLC – September 2026, SF + Condo/TH/Apt.

What the September 2026 Numbers Mean for Jericho

Home prices: a monthly gain on top of a 12-month rise

The median sold price in Jericho was $1,225,000 in September, up 5.2% from August. RPR’s median estimated property value for Jericho stands at $1,365,840, essentially flat month over month (−0.1%) and up 4.1% over the past 12 months. RPR’s long-term value chart also shows Jericho values sitting above Nassau County, New York State and national levels. With only 14 closings in the month, the monthly sold median can shift noticeably depending on which homes close, so the 12-month value trend is the steadier guide to where equity is heading.

Median Price by Market Stage

New listings
$1.39M
Active
$1.50M
New pending
$1.54M
All pending
$1.40M
Sold
$1.23M

Source: Realtors Property Resource®, LLC – September 2026, SF + Condo/TH/Apt.

Inventory: more supply than a year ago

Jericho had 4.5 months of inventory in September, up 3.2% from August and up 71.8% over the past 12 months. In practical terms, if no new homes came to market, the current supply would take about four and a half months to sell — still within seller’s-market territory by RPR’s measure, but a clear increase in choice compared with last year. There were 45 active listings (down 6.3% month over month) with a median list price of $1.5M, unchanged from August. 13 new listings came to market during the month (unchanged) at a median list price of $1.39M, up 2.8%.

Number of Properties by Market Stage

New listings
13
Active
45
New pending
6
All pending
21
Sold
14

Source: Realtors Property Resource®, LLC – September 2026, SF + Condo/TH/Apt.

Days on market: sold homes moved faster, listings are sitting longer

Homes that sold in September had a median of 33 days in RPR, down 13.2% from August. Earlier in the pipeline, new pending listings took a median of 37 days to go under contract (up 5.7%), and the broader pending pool sits at 36 days (up 2.9%). Active listings tell a different story: their median rose to 97 days, up 24.4%. Homes priced in line with the market are still selling in about a month, while the listings that remain are taking considerably longer to attract a buyer.

Median Days in RPR by Market Stage

Sold
33 days
New pending
37 days
All pending
36 days
Active
97 days

Source: Realtors Property Resource®, LLC – September 2026, SF + Condo/TH/Apt.

Price per square foot and home size

Sold homes closed at a median of $603 per square foot, up 14.2% month over month. Active listings are asking a median of $592 per square foot (down 0.7%) for a median of 2,762 square feet, while new listings came in at $665 per square foot (up 13.7%) with a median of 2,232 square feet. New pending listings had the highest figure at $682 per square foot, on a median of 2,115 square feet.

Median Price per Square Foot by Market Stage

New listings
$665
Active
$592
New pending
$682
All pending
$615
Sold
$603

Source: Realtors Property Resource®, LLC – September 2026, SF + Condo/TH/Apt.

Sales activity and pending contracts

A total of 14 homes sold in Jericho in September, up 7.7% from August, for a total dollar volume of $17.69 million (up 14.2%). The pipeline is thinner heading into fall: 6 new pending listings (down 40%) and 21 total pending listings (down 30%), with pending volume of $31.96 million (down 21.8%). The median list price of pending homes was $1.4M, up 2.4%. RPR did not report sold public-records data for Jericho this month because there was not enough activity to calculate it.

Jericho – September 2026, SF + Condo/TH/Apt. Source: Realtors Property Resource®, LLC. Changes are month over month.
Category # of Properties Median Price Median $/Sq Ft Median Days Total $ Volume
Sold 14 (↑7.7%) $1.23M sold (↑5.2%) $603 (↑14.2%) 33 (↓13.2%) $17.69M (↑14.2%)
Active 45 (↓6.3%) $1.50M list (0%) $592 (↓0.7%) 97 (↑24.4%) $78.25M (↓5.5%)
New Listings 13 (0%) $1.39M list (↑2.8%) $665 (↑13.7%) — $20.97M (↑21.5%)
New Pending 6 (↓40%) $1.54M list (↑10.8%) $682 (↑9.5%) 37 (↑5.7%) $10.34M (↓20.6%)
All Pending 21 (↓30%) $1.40M list (↑2.4%) $615 (↑3.9%) 36 (↑2.9%) $31.96M (↓21.8%)

Jericho Closed Sales Snapshot (Past 12 Months)

To look past a single month, we calculated the past 12 months of Jericho closed sales from a OneKey® MLS report: 124 homes closed between October 30, 2025 and October 23, 2026, at a median of $1,245,000 and an average of $1,349,000. Prices ranged from $795,000 to $3,100,000, and the largest groups sold between $1 million and $1.5 million. Over the year, homes had a median of 31.5 days on market and closed at a median of 98% of list price.

These figures differ slightly from RPR’s September numbers because they cover a full year rather than one month, and both are accurate for their own scope. Together they show a market where most Jericho homes trade in the low-to-mid $1 millions, and where the typical sale closes a little below asking. Buyers can use these figures to set realistic offers; sellers can use them to price where buyers have actually been paying.

Closed Sales

124

Median Sold Price

$1,245,000

Average Sold Price

$1,349,000

Median Days on Market

31.5

Median $/Sq Ft

$588

Median Sold-to-List

98%

Sold prices ranged from $795,000 to $3,100,000. Source: OneKey MLS closed sales report, Jericho, October 30, 2025 to October 23, 2026. Calculated by Educators Realty from 124 closed sales; information not guaranteed.

Closed Sales by Price Range

Under $1M
25
$1M–$1.249M
37
$1.25M–$1.499M
35
$1.5M–$1.999M
16
$2M and above
11

Source: OneKey MLS closed sales report, Jericho, October 30, 2025 to October 23, 2026. Calculated by Educators Realty from 124 closed sales; information not guaranteed.

What This Market Means for Jericho Buyers

  • You have more to choose from. At 4.5 months of inventory, up 71.8% over 12 months, Jericho buyers have noticeably more options than a year ago.
  • There is room to negotiate. Sold homes closed at a median of 96.99% of list price in September, and the 12-month median was 98%, so offers below asking are often part of the conversation.
  • Watch the long-listed homes. Active listings show a median of 97 days in RPR, up 24.4%. Homes that have been on the market for a while may offer more flexibility on price or terms.
  • Well-priced homes still go quickly. Sold homes had a median of just 33 days in RPR, so having a mortgage pre-approval ready lets you act when the right home appears.

What This Market Means for Jericho Sellers

  • Prices are holding up. The median sold price rose 5.2% to $1,225,000, and the median estimated value is up 4.1% over 12 months.
  • Price to the market, not the high end. Active listings carry a $1.5M median list price, while the median sold price was $1,225,000. Homes priced in line with recent sales are the ones that sell in about a month.
  • Expect buyers to compare. With supply up sharply over the year, presentation and condition matter more for standing out among 45 active listings.
  • Fewer new pendings means less momentum. New pending listings fell 40% in September, so a carefully prepared listing can help capture the buyers who are actively shopping this fall.

Where Homes Sold: Price Ranges Across Jericho

The 20 recent sales featured below come from across Jericho and illustrate the town’s price range:

  • Under $1 million (5 homes): Manors Drive, Halsey Avenue, Golf View Drive and Gardner Avenue, from $875,000 to $998,000.
  • $1 million–$1.249 million (5 homes): Cumberland Road, Flint Lane, N Marginal Road, Halsey Avenue and Country Club Drive, from $1,085,000 to $1,235,000 — right around Jericho’s $1,225,000 September median sold price.
  • $1.25 million–$1.499 million (5 homes): Cortland Avenue, Ulster Drive, Sagamore Way N, Seneca Place and Maytime Court, from $1,408,000 to $1,480,000.
  • $1.5 million and above (5 homes): Vista Drive, Foxwood Drive, Woodbridge Lane, Saint Lawrence Place and Holiday Pond Road, from $1,540,000 to $2,728,000.

The featured homes range from 3 to 5 bedrooms: nine have 3 bedrooms, eight have 4 and three have 5. Two of the addresses include unit numbers (Golf View Drive and Foxwood Drive). These featured sales are a sample of recent activity, not a statistical summary — for town-wide figures, refer to the RPR data and the Closed Sales Snapshot above.

Recently Sold in Jericho, NY

Below are 20 homes that recently sold in Jericho. Click any address, photo or button to view full property details on educatorsrealty.com.

15 Manors Drive, Jericho, NY – recently sold homeSold

15 Manors Drive, Jericho

$875,000

3 Beds  |  3 Baths

The lowest-priced of this month’s featured sales: a 3-bedroom, 3-bath home on Manors Drive that sold for $875,000.

View Property Details

MLS# 994231 • Listing courtesy of OneKey® MLS

Jericho Real Estate FAQs

Is Jericho, NY a buyer's or seller's market right now?

Based on September 2026 data from Realtors Property Resource (RPR), Jericho is classified as a seller's market, with 4.5 months of inventory. Supply is up 71.8% over the past 12 months, and sold homes closed at a median of 96.99% of list price.

What is the median sold price of a home in Jericho?

The median sold price for single-family homes, condos, townhouses and apartments in Jericho was $1,225,000 in September 2026, up 5.2% from the prior month, according to RPR. The median estimated property value was $1,365,840, up 4.1% over 12 months.

How fast are homes selling in Jericho?

Homes that sold in September 2026 had a median of 33 days in RPR, down 13.2% month over month. Active listings showed a median of 97 days, up 24.4%.

How many homes are for sale in Jericho?

RPR reported 45 active listings in Jericho for September 2026, down 6.3% month over month, with 13 new listings coming to market during the month.

What is the price per square foot in Jericho?

Sold homes in September 2026 had a median of $603 per square foot, up 14.2% month over month. Active listings had a median of $592 per square foot.

Thinking About Buying or Selling in Jericho?

Educators Realty is a boutique brokerage based in Syosset serving buyers and sellers in Jericho and throughout Long Island. Whether you want to ask about one of the homes above, schedule a private showing, request more recent sales on a specific street, refine your home search, or find out what your home could sell for in today’s market, we’re here to help.

Your AgentTe-Mei (Demi) Lee
Licensed Real Estate Salesperson
(516) 967-7552
demi.lee@educatorsrealty.com
BrokerageEducators Realty
332 Jackson Ave, Syosset, NY 11791
(516) 517-2400
educatorsrealty.com
Call (516) 967-7552 Get a Home Valuation Search Jericho Homes

By:
Te-Mei (Demi) Lee
Licensed Real Estate Salesperson
Certified Buyer Representative (CBR)
(516) 967-7552
demi.lee@educatorsrealty.com

Market statistics: Realtors Property Resource®, LLC, Jericho, NY Market Trends, September 2026 (SF + Condo/TH/Apt), retrieved October 24, 2026. Information is not guaranteed.

Listings courtesy of OneKey® MLS as distributed by MLS GRID. Based on information submitted to the MLS GRID as of 2026-10-24 at 6:36 pm. All data is obtained from various sources and may not have been verified by broker or MLS GRID. All information should be independently reviewed and verified for accuracy. Properties may or may not be listed by the office/agent presenting the information.

Educators Realty, Inc., 332 Jackson Ave, Syosset, NY 11791. Equal Housing Opportunity. We are pledged to the letter and spirit of federal and New York State fair housing laws. NYS Fair Housing Notice.

Posted in Demi's Blog
Oct. 24, 2026

How Much Are Closing Costs on Long Island? A 2026 Guide for Buyers and Sellers

Updated October 2026. Figures are estimates for education only; your attorney and lender will give you exact numbers.

The Quick Answer

On Long Island, buyers who finance typically pay about 2% to 4% of the purchase price in closing costs, plus prepaid taxes and insurance. That range does not include buyer's agent compensation, which since the 2024 NAR settlement is agreed in writing between you and your agent, and is often requested from the seller as part of your offer (more below). Sellers pay the 0.4% New York State transfer tax, their attorney, a few title and recording fees, and whatever commission they negotiated with their listing broker.

The biggest swing factors are your loan amount (mortgage recording tax), whether the price hits $1 million (the mansion tax), and whether the home is on the East End, where the Peconic Bay transfer tax applies. Below is a line-by-line breakdown, followed by a worked example on a $750,000 Nassau County home.

Buyer Closing Costs on Long Island

The largest buyer costs are usually the mortgage recording tax, title insurance and attorney fees. Here is what a typical buyer of a house or condo pays.

Cost Typical Amount Notes
Buyer's agent compensation As agreed in your written buyer agreement Not a fixed rate; it is negotiated with your agent before you tour homes. Buyers often ask the seller to pay some or all of it as a term of the offer. If the seller agrees, it comes out of the seller's proceeds instead of your cash at closing.
Mortgage recording tax 0.80% of the loan amount Applies to one- and two-family homes and residential condos in Nassau and Suffolk. The full rate is 1.05%, but the lender pays 0.25% on these properties. Three-plus family, commercial and vacant land pay 1.05%. Not charged on co-op share loans.
Mansion tax 1% of the full price Only when the price is $1,000,000 or more. Paid by the buyer on residential property, including co-ops.
Owner's title insurance About $450 per $100,000 of price Protects your ownership. In New York the buyer pays for it. Rates are state-regulated, so quotes are similar across title companies.
Lender's (mortgage) title insurance About $130 per $100,000 of loan Required by your lender.
Buyer's attorney Commonly $2,000 to $4,000 Varies with price and complexity. Get a written quote.
Bank attorney About $650 to $750 Your lender's attorney; the buyer pays this fee.
Lender fees About $1,000 to $1,500 Application, processing and underwriting fees vary by lender.
Appraisal $300 to $1,500 Depends on price and property type.
Municipal and title searches About $350 to $500 Checks for open permits, violations and liens.
Recording fees (deed and mortgage) Several hundred to $1,500+ Nassau adds a $300 block fee and a $270 tax map verification letter for each document recorded. Suffolk charges its own verification fees.
Tax and insurance escrows 2 to 6 months of property taxes, plus the first year of homeowners insurance Not a fee, but cash you need at closing. Long Island property taxes make this a large number.
Property tax and fuel adjustments Varies You reimburse the seller for taxes they prepaid past the closing date, and sometimes for oil left in the tank.

Buying a co-op? Co-op buyers skip title insurance and the mortgage recording tax. Instead they pay for a lien search, a recognition agreement and UCC filing, plus any building fees. The mansion tax still applies at $1 million or more.

How the NAR Settlement Changed Closing Costs

Since August 17, 2024, who pays the buyer's agent is something buyers and sellers decide deal by deal. Before then, the seller's listing agreement typically covered both agents, and buyers rarely saw that cost.

Three practice changes from the National Association of REALTORS® settlement drive this:

  • Written buyer agreements come first. Before touring a home with an agent, you sign an agreement that states how much your agent will be paid. The amount must be specific, and your agent cannot collect more than it from any source.
  • No compensation offers in the MLS. Listings no longer advertise what the seller will pay a buyer's agent. A seller can still offer it; it just isn't published in the MLS.
  • Everything is negotiable. Your agent's compensation can be paid by the seller, by the listing brokerage, by you, or split among them.

What this means for your budget. Many Long Island buyers include a request in their offer that the seller pay their agent's compensation. Sellers often agree, especially when the alternative is a buyer who can't cover it. Whatever the seller doesn't cover, you pay at closing in cash; it cannot be added to your mortgage.

Good news for financed buyers. Fannie Mae, Freddie Mac and the FHA have confirmed that a seller paying the buyer's agent does not count toward their limits on seller concessions. That means asking the seller to cover your agent doesn't reduce the closing-cost credit you can also negotiate.

Seller Closing Costs on Long Island

Sellers have fewer line items than buyers. Outside of commission, the main ones are the state transfer tax and the seller's attorney.

Cost Typical Amount Notes
Real estate commission Negotiated There is no standard rate. Your listing broker's fee is set in your listing agreement. Whether you also pay the buyer's agent is a separate decision, usually made when a buyer asks for it in their offer.
NYS real estate transfer tax 0.4% of the price ($4 per $1,000) Paid by the seller on every Long Island sale. The higher NYC rates do not apply in Nassau or Suffolk.
Seller's attorney Commonly $2,000 to $4,000 Get a written quote.
Mortgage payoff and satisfaction A few hundred dollars Covers the title closer's pick-up fee and recording the satisfaction of your mortgage. In Nassau this includes the $300 block fee and the $270 tax map verification letter.
Miscellaneous title fees About $200 to $500 Clearing old liens or judgments can add more.
Co-op items Varies by building Co-op sellers may owe a flip tax (often 1% to 3% of the price, if the building has one), a co-op attorney fee and move-out fees.
Concessions or credits Negotiated Any credit you agree to give the buyer at closing, for example for repairs found at inspection.

Sellers also get money back at closing: the buyer reimburses you for property taxes you prepaid beyond the closing date.

Buying on the East End: The Peconic Bay Tax

Buyers in the five East End towns pay an extra one-time transfer tax that can easily be the largest item on their closing statement. It funds open-space preservation and, in most of those towns, affordable housing.

Town Rate on the Taxable Portion First-Time Buyer Exemption
East Hampton 2.5% (2% preservation + 0.5% housing fund) Yes, with eligibility limits
Southampton 2.5% (2% preservation + 0.5% housing fund) Yes, with eligibility limits
Shelter Island 2.5% Yes, with eligibility limits
Southold 2.5% Yes, with income and price limits
Riverhead 2% Historically no; confirm current status with your attorney

The tax applies only above an exempt allowance, which differs by town and by whether the land is improved or vacant. Exemption rules have changed several times since 2021, so confirm the current figures with your attorney before you budget.

Other things that change the math:

  • New construction. Buyers of new homes or new condos are often asked by contract to pay costs a seller normally pays, such as the transfer tax and the seller's attorney.
  • Seller concessions. A buyer can negotiate a credit toward closing costs, but lenders cap how much is allowed.

Worked Example: A $750,000 Home in Nassau County

On a $750,000 single-family home with a $600,000 mortgage, the buyer's fees come to roughly $16,100 (about 2.1%), or about $23,500 once escrows are funded. The seller pays roughly $6,450 plus commission. Buyer's agent compensation is shown separately because it depends on what the buyer and seller negotiate.

Buyer (20% down, $600,000 loan)

Item Estimate
Mortgage recording tax (0.80% of $600,000, less $30) $4,770
Owner's title insurance $3,375
Lender's title insurance $780
Buyer's attorney $2,500
Recording fees (deed and mortgage, incl. block and tax map fees) $1,545
Lender fees $1,430
Bank attorney $700
Appraisal $600
Municipal searches $400
Closing fees subtotal $16,100
Tax escrow (4 months, assuming $15,000/year in taxes) $5,000
First-year homeowners insurance (assumed) $2,400
Total cash for closing costs $23,500
Buyer's agent compensation Per your buyer agreement, minus any amount the seller agrees to pay

Seller

Item Estimate
NYS transfer tax (0.4%) $3,000
Seller's attorney $2,500
Mortgage satisfaction recording (Nassau) $600
Title closer pick-up and misc. title fees $350
Total before commission $6,450
Listing broker's commission As negotiated in your listing agreement
Buyer's agent compensation Only if you agree to it, usually as part of the accepted offer

At $1,000,000 or more, add the 1% mansion tax for the buyer: $10,000 on a $1 million purchase. That's why buyers and sellers sometimes negotiate hard around that price point.

Frequently Asked Questions

Who pays the transfer tax in New York?

The seller pays the 0.4% New York State transfer tax. The buyer pays the 1% mansion tax when the price is $1 million or more.

Is there a mansion tax on Long Island?

Yes. The 1% New York State mansion tax applies statewide on residential purchases of $1 million or more. The higher, tiered mansion tax rates apply only in New York City.

What is the mortgage recording tax in Nassau and Suffolk?

The total rate is 1.05% of the loan. On one- and two-family homes and residential condos, the borrower pays 0.80% and the lender pays the rest.

Can closing costs be negotiated?

Some can. Attorney fees, lender fees and commission are negotiable, and buyers can ask for a seller credit. Taxes and government recording fees are fixed.

Are closing costs cheaper for a co-op?

Often, yes. Co-op buyers don't pay title insurance or mortgage recording tax, though building fees and flip taxes can offset some of the savings.

How much cash should I have for closing on Long Island?

Plan for roughly 3% to 4% of the price on top of your down payment once escrows are included. Your lender's Loan Estimate will give you a written figure early in the process.

Who pays the buyer's agent on Long Island now?

It depends on the deal. Since the 2024 NAR settlement, a buyer agrees in writing to their agent's compensation before touring homes. The buyer can then ask the seller to pay it in the offer, pay it themselves at closing, or split it.

About the Author

[Your name] is the Broker/Owner of Educators Realty in Syosset, NY, and teaches the New York State Real Estate Salesperson licensing course at Molloy University. Educators Realty helps buyers, sellers, landlords and tenants across Long Island and the five boroughs. Have a question about your closing costs? Call (516) 517-2400.

Sources

This article is for general education and is not legal, tax or financial advice. Closing costs vary by property and transaction; consult your attorney and lender for exact figures. Educators Realty is committed to the letter and spirit of federal, New York State and local fair housing laws. Equal Housing Opportunity.

Oct. 15, 2026

Suffolk County, NY Real Estate Market Report: October 2026

Your monthly look at Suffolk County home prices, inventory and recent sales, using September 2026 data from Realtors Property Resource® (RPR) and OneKey® MLS.

If you are buying or selling a home in Suffolk County this fall, the September 2026 numbers describe a market that is still competitive but easing slightly from its summer pace. RPR classifies Suffolk County as a seller’s market: there were just 3.53 months of inventory, and the typical home sold for 101.98% of its list price. At the same time, the median sold price slipped 2% to $735,000, fewer homes closed than in August, and homes took a few more days to sell.

For buyers, that means a little more time to make decisions than earlier in the year, although well-priced homes are still drawing strong offers. For sellers, demand remains solid, but pricing and presentation matter more as the season turns. Below, we break down what the September data shows, what it means for each side of a transaction, and 20 recently sold homes from across the county — from a Patchogue co-op and a Commack Colonial to a contemporary in Miller Place and an 8-bedroom residence in East Hampton.

Suffolk County Market at a Glance (September 2026)

Median Sold Price

$735,000

↓ 2% month over month

Months of Inventory

3.53

↓ 4.9% MoM • ↓ 8.5% over 12 months

Sold-to-List Price

101.98%

↓ 0.5% month over month

Median Days (Sold)

33

↑ 13.8% month over month

Median Est. Value

$734,780

↑ 0.1% MoM • ↑ 3.9% over 12 months

Homes Sold

1,149

↓ 11.3% month over month

Property types: SF + Condo/TH/Apt. Source: Realtors Property Resource®, LLC, report dated October 15, 2026.

Suffolk County Market Type (RPR, September 2026)

▼    
     
Seller’s Market Balanced Buyer’s Market

Source: Realtors Property Resource®, LLC – September 2026, SF + Condo/TH/Apt.

What Changed From August to September 2026

Median sold price
▼ -2%
Homes sold
▼ -11.3%
Active listings
▼ -5.6%
New listings
▼ -5.9%
Months of supply
▼ -4.9%
Median days (sold)
▲ +13.8%
Sold $/sq ft
▼ -0.5%
Median est. value
▲ +0.1%

Increase    Decrease  •  Bar length shows size of change

Source: Realtors Property Resource®, LLC – September 2026, SF + Condo/TH/Apt.

What the September 2026 Numbers Mean for Suffolk County

Home prices: a small monthly dip, steady longer-term gains

The median sold price in Suffolk County was $735,000 in September, down 2% from August. A single month’s median depends on which homes happen to close, so it helps to look at a broader measure as well: RPR’s median estimated property value for the county is $734,780, up 0.1% month over month and up 3.9% over the past 12 months. The two measures now sit almost exactly side by side, and underlying values continue to edge higher even as the monthly sold median eased. RPR’s long-term value chart also shows Suffolk County values sitting above both New York State and national levels.

Median Price by Market Stage

New listings
$725K
Active
$849K
New pending
$700K
All pending
$700K
Sold
$735K

Source: Realtors Property Resource®, LLC – September 2026, SF + Condo/TH/Apt.

Inventory: tighter than last month and last year

Suffolk County had 3.53 months of inventory in September, down 4.9% from August and down 8.5% from a year earlier. In practical terms, if no new homes came to market, the current supply would sell out in about three and a half months — a level generally associated with sellers holding the advantage. There were 3,887 active listings (down 5.6% month over month) with a median list price of $849K (up 2%), and 1,568 new listings came to market during the month (down 5.9%) at a median list price of $725K (up 1.4%).

Number of Properties by Market Stage

New listings
1,568
Active
3,887
New pending
1,117
All pending
2,887
Sold
1,149

Source: Realtors Property Resource®, LLC – September 2026, SF + Condo/TH/Apt.

Days on market: a little slower to sell

Homes that sold in September spent a median of 33 days in RPR, up 13.8% from August. The slowdown shows up earlier in the pipeline too: new pending listings took a median of 40 days to go under contract (up 14.3%), and the broader pending pool sits at 36 days (up 9.1%). Active listings show a median of 56 days, unchanged from the prior month. Homes are still selling in roughly a month, but buyers are taking somewhat more time than they were in late summer.

Median Days in RPR by Market Stage

Sold
33 days
New pending
40 days
All pending
36 days
Active
56 days

Source: Realtors Property Resource®, LLC – September 2026, SF + Condo/TH/Apt.

Price per square foot and home size

Sold homes closed at a median of $421 per square foot, down 0.5% month over month. Active listings are asking a median of $468 per square foot (up 0.9%) for a median of 2,000 square feet of living area, while new listings came in at $426 per square foot and a median of 1,815 square feet. Pending listings show a median of $411 per square foot and 1,816 square feet. The gap between what active listings are asking per foot and what sold homes actually achieved is worth keeping in mind on both sides of the table.

Median Price per Square Foot by Market Stage

New listings
$426
Active
$468
New pending
$411
All pending
$411
Sold
$421

Source: Realtors Property Resource®, LLC – September 2026, SF + Condo/TH/Apt.

Sales activity and pending contracts

A total of 1,149 homes sold in Suffolk County in September, down 11.3% from August, for a total dollar volume of $1.17 billion (down 3.8%). Looking ahead, 1,117 new pending listings (down 8%) and 2,887 total pending listings (down 1.8%) point to a steady flow of closings in the coming weeks. The median list price of pending homes held flat at $700K.

Suffolk County – September 2026, SF + Condo/TH/Apt. Source: Realtors Property Resource®, LLC. Changes are month over month.
Category # of Properties Median Price Median $/Sq Ft Median Days Total $ Volume
Sold 1,149 (↓11.3%) $735K sold (↓2%) $421 (↓0.5%) 33 (↑13.8%) $1.17B (↓3.8%)
Active 3,887 (↓5.6%) $849K list (↑2%) $468 (↑0.9%) 56 (0%) $6.99B (↓5.2%)
New Listings 1,568 (↓5.9%) $725K list (↑1.4%) $426 (↓0.2%) — $1.76B (↓8.3%)
New Pending 1,117 (↓8%) $700K list (0%) $411 (↓1%) 40 (↑14.3%) $1.14B (↓6.9%)
All Pending 2,887 (↓1.8%) $700K list (0%) $411 (↓0.2%) 36 (↑9.1%) $3.26B (↓0.8%)

What This Market Means for Suffolk County Buyers

  • Expect competition on well-priced homes. Sold homes closed at a median of 101.98% of list price, so the best-presented properties are still drawing offers at or above asking.
  • Use the extra time wisely. Sold homes took a median of 33 days and new pendings took 40 days, both up from August. That gives you a little more room to tour, compare and line up financing and inspections before committing.
  • Watch the gap between list and sold prices. Active listings carry an $849K median list price and $468 per square foot, while sold homes came in at $735,000 and $421 per square foot. Not every listing is priced where the market will meet it — reviewing recent comparable sales before making an offer is essential.
  • Be ready before you shop. Months of supply are down 8.5% from a year ago, so having a mortgage pre-approval in hand helps you act quickly when the right home appears.

What This Market Means for Suffolk County Sellers

  • Conditions still favor sellers. RPR rates Suffolk County a seller’s market, and 3.53 months of supply keeps buyers competing for limited inventory.
  • Price to the market, not the headlines. Longer days to pending show that buyers are being more selective. Homes priced in line with recent comparable sales are the ones that move.
  • Equity has grown. The median estimated value is up 3.9% over the past 12 months, so many owners have more equity than they may realize. A current home valuation can clarify your options.
  • Fall listings face less competition. With active listings down 5.6% and new listings down 5.9% month over month, a well-prepared home can stand out this season.

Where Homes Sold: Price Ranges Across Suffolk County

The 20 recent sales featured below come from 20 different Suffolk County communities — South Shore, North Shore, the North Fork and the Hamptons — and illustrate just how wide the county’s price spectrum is:

  • Under $500,000 (4 homes): a co-op in Patchogue and a condo in Coram, plus homes in Mastic Beach and Shirley, between $360,000 and $450,000.
  • $500,000–$799,999 (6 homes): a semi-attached condominium in Ridge and homes in Lindenhurst, Islip, Port Jefferson Station, Copiague and Nesconset, between $549,900 and $770,000 — bracketing the county’s $735,000 median sold price.
  • $800,000–$999,999 (4 homes): East Quogue, Miller Place, East Northport and Commack.
  • $1 million–$1.99 million (3 homes): East Islip, New Suffolk and a residence at High Dune Townhomes on Dune Road in Westhampton.
  • $2 million and above (3 homes): Huntington Bay ($2,250,000), Westhampton Beach ($2,800,000) and East Hampton ($3,855,000).

Architectural variety is also on display: Capes in Shirley, Lindenhurst and Islip (a 1930 Cape Cod), ranches in Port Jefferson Station, Copiague and Huntington Bay, Colonials in Nesconset, Commack and East Islip, a split-level in East Northport and a contemporary in Miller Place, along with a co-op, two condos and an oceanfront townhome. These featured sales are a sample of recent activity, not a statistical summary — for county-wide figures, refer to the RPR data above.

Recently Sold in Suffolk County, NY

Below are 20 homes that recently sold in Suffolk County. Click any address, photo or button to view full property details on educatorsrealty.com.

Suffolk County Real Estate FAQs

Is Suffolk County, NY a buyer's or seller's market right now?

Based on September 2026 data from Realtors Property Resource (RPR), Suffolk County is classified as a seller's market, with 3.53 months of inventory and homes selling at a median of 101.98% of list price.

What is the median sold price of a home in Suffolk County?

The median sold price for single-family homes, condos, townhouses and apartments in Suffolk County was $735,000 in September 2026, down 2% from the prior month, according to RPR. The median estimated property value was $734,780, up 3.9% over 12 months.

How fast are homes selling in Suffolk County?

Homes that sold in September 2026 had a median of 33 days in RPR, up 13.8% month over month. New pending listings took a median of 40 days to go under contract, and active listings showed a median of 56 days.

How many homes are for sale in Suffolk County?

RPR reported 3,887 active listings in Suffolk County for September 2026, down 5.6% month over month, with 1,568 new listings coming to market during the month.

What is the price per square foot in Suffolk County?

Sold homes in September 2026 had a median of $421 per square foot, down 0.5% month over month. Active listings had a median of $468 per square foot.

Thinking About Buying or Selling in Suffolk County?

Educators Realty is a boutique brokerage based in Syosset serving buyers and sellers throughout Long Island, including Suffolk County. Whether you want to ask about one of the homes above, schedule a private showing, request more recent sales in a specific town, refine your home search, or find out what your home could sell for in today’s market, we’re here to help.

Your AgentChristopher Robson
Licensed Real Estate Broker
(516) 459-9564
chris@educatorsrealty.com
BrokerageEducators Realty
332 Jackson Ave, Syosset, NY 11791
(516) 517-2400
educatorsrealty.com
Call (516) 459-9564 Get a Home Valuation Search Suffolk County Homes

By:
Christopher Robson
Licensed Real Estate Broker
Molloy University Real Estate Faculty
(516) 459-9564
chris@educatorsrealty.com

Market statistics: Realtors Property Resource®, LLC, Suffolk County, NY Market Trends, September 2026 (SF + Condo/TH/Apt), retrieved October 15, 2026. Information is not guaranteed.

Listings courtesy of OneKey® MLS as distributed by MLS GRID. Based on information submitted to the MLS GRID as of 2026-10-15 at 11:54 am. All data is obtained from various sources and may not have been verified by broker or MLS GRID. All information should be independently reviewed and verified for accuracy. Properties may or may not be listed by the office/agent presenting the information.

Educators Realty, Inc., 332 Jackson Ave, Syosset, NY 11791. Equal Housing Opportunity. We are pledged to the letter and spirit of federal and New York State fair housing laws. NYS Fair Housing Notice.

Oct. 15, 2026

Farmingdale, NY Real Estate Market Report: October 2026

Your monthly look at Farmingdale home prices, inventory and recent sales, using September 2026 data from Realtors Property Resource® (RPR) and OneKey® MLS.

If you are buying or selling a home in Farmingdale this fall, the September numbers point to a market that remains competitive. RPR classifies Farmingdale as a seller’s market, inventory dropped to just 1.79 months of supply, and the typical home that sold in September closed at 102.16% of its list price — above asking. At the same time, the median sold price eased to $725,000, down 15% from August, while the number of closings jumped by two-thirds.

For buyers, that combination means well-priced homes still draw strong interest, but the right listing may not cost quite as much as it did over the summer. For sellers, it means limited competition and solid demand, as long as the home is priced in line with recent sales. Below, we break down what the September 2026 data shows, add a closed-sales snapshot covering the past six months, and feature 20 recently sold Farmingdale properties — from co-ops near downtown to Capes in the Woodward Parkway area, homes in Lenox Hills and the Incorporated Village, and a Contemporary Colonial in Melville Court.

Farmingdale Market at a Glance (September 2026)

Median Sold Price

$725,000

↓ 15% month over month

Months of Inventory

1.79

↓ 32.2% MoM • ↑ 21.8% over 12 months

Sold-to-List Price

102.16%

↓ 0.9% month over month

Median Days (Sold)

29

↑ 26.1% month over month

Median Est. Value

$826,760

↑ 0.3% MoM • ↑ 14% over 12 months

Homes Sold

20

↑ 66.7% month over month

Property types: SF + Condo/TH/Apt. Source: Realtors Property Resource®, LLC, report dated October 15, 2026.

Farmingdale Market Type (RPR, September 2026)

▼    
     
Seller’s Market Balanced Buyer’s Market

Source: Realtors Property Resource®, LLC – September 2026, SF + Condo/TH/Apt.

What Changed From August to September 2026

Median sold price
▼ -15%
Homes sold
▲ +66.7%
Active listings
▼ -32.4%
New listings
▼ -37.5%
Months of supply
▼ -32.2%
Median days (sold)
▲ +26.1%
Sold $/sq ft
▼ -8.2%
Median est. value
▲ +0.3%

Increase    Decrease  •  Bar length shows size of change

Source: Realtors Property Resource®, LLC – September 2026, SF + Condo/TH/Apt.

What the September 2026 Numbers Mean for Farmingdale

Home prices: a monthly dip, but a big 12-month gain

The median sold price in Farmingdale was $725,000 in September, down 15% from August. With 20 sales in the month, the mix of homes that happened to close can move the median noticeably. The longer-term trend is strong: RPR’s median estimated property value for Farmingdale stands at $826,760, up 0.3% month over month and up 14% over the past 12 months. For gauging equity, the 12-month value trend is usually a steadier guide than a single month of sales.

Median Price by Market Stage

New listings
$740K
Active
$749K
New pending
$750K
All pending
$750K
Sold
$725K

Source: Realtors Property Resource®, LLC – September 2026, SF + Condo/TH/Apt.

Inventory: tight, and tighter than last month

Farmingdale had 1.79 months of inventory in September, down 32.2% from August. That is still up 21.8% from a year earlier, but in practical terms, if no new homes came to market, current supply would sell out in less than two months — a level that strongly favors sellers. There were only 25 active listings (down 32.4%) with a median list price of $749K. New supply slowed too: 15 new listings came to market during the month, down 37.5%, at a median list price of $740K.

Number of Properties by Market Stage

New listings
15
Active
25
New pending
18
All pending
39
Sold
20

Source: Realtors Property Resource®, LLC – September 2026, SF + Condo/TH/Apt.

Days on market: still quick, but slowing a bit

Homes that sold in September had a median of 29 days in RPR, up 26.1% from August. New pending listings went under contract in a median of 28 days (up 33.3%), and the broader pending pool sits at 41 days (up 41.4%). Active listings also show a median of 41 days, up 70.8%. Homes are still moving quickly by most standards, but buyers are taking a little more time than they did in August.

Median Days in RPR by Market Stage

Sold
29 days
New pending
28 days
All pending
41 days
Active
41 days

Source: Realtors Property Resource®, LLC – September 2026, SF + Condo/TH/Apt.

Price per square foot and home size

Sold homes closed at a median of $492 per square foot in September, down 8.2% from August. Active listings are asking a median of $495 per square foot for a median of 1,440 square feet, while new listings came in at $509 per square foot (up 4.1%) with a median of 1,283 square feet. New pending listings carried a median of $477 per square foot and 1,556 square feet.

Median Price per Square Foot by Market Stage

New listings
$509
Active
$495
New pending
$477
All pending
$486
Sold
$492

Source: Realtors Property Resource®, LLC – September 2026, SF + Condo/TH/Apt.

Sales activity and pending contracts

A total of 20 homes sold in Farmingdale in September, up 66.7% from August, for a total dollar volume of $15.58 million (up 57.6%). The pipeline remains steady: 18 new pending listings (up 5.9%) and 39 total pending listings (down 4.9%), with pending homes carrying a median list price of $750K. Because these figures reflect a single community with a modest number of monthly sales, they can swing more from month to month than county-wide numbers do.

Farmingdale – September 2026, SF + Condo/TH/Apt. Source: Realtors Property Resource®, LLC. Changes are month over month.
Category # of Properties Median Price Median $/Sq Ft Median Days Total $ Volume
Sold 20 (↑66.7%) $725K sold (↓15%) $492 (↓8.2%) 29 (↑26.1%) $15.58M (↑57.6%)
Active 25 (↓32.4%) $749K list (↓0.1%) $495 (↑3.8%) 41 (↑70.8%) $19.94M (↓27.8%)
New Listings 15 (↓37.5%) $740K list (↑0.1%) $509 (↑4.1%) — $11.71M (↓32.9%)
New Pending 18 (↑5.9%) $750K list (↓6.1%) $477 (↓11.3%) 28 (↑33.3%) $13.49M (↓0.7%)
All Pending 39 (↓4.9%) $750K list (↓0.7%) $486 (↓4.5%) 41 (↑41.4%) $30.44M (↓5.9%)

Farmingdale Closed Sales Snapshot (April 21 – October 7, 2026)

To look beyond a single month, we also analyzed a OneKey MLS closed-sales report covering 101 Farmingdale sales that closed between April 21 and October 7, 2026. Over that period, the median sale price was $805,000 and the average was about $820,000, with prices ranging from $520,000 to $1,465,000. Homes spent a median of just 19 days on market, and the median price per square foot was $511 (based on the 100 sales that reported living area). Measured against original list price, the median sale closed at 102.9% of the starting price, and 68 of the 101 homes sold at or above their original asking price.

These figures differ from RPR’s September numbers because they cover a longer window and a different mix of properties — none of the 101 sales in this report is a unit-numbered condo or co-op, while RPR’s figures include condos, townhouses and apartments. Both are accurate for their own scope. Together, they show that most Farmingdale homes sold quickly and at or above asking through the spring and summer, with most sales falling between $700,000 and $899,999.

Closed Sales

101

Median Sold Price

$805,000

Average Sold Price

$820,179

Median Days on Market

19

Median $/Sq Ft

$511

Sold prices ranged from $520,000 to $1,465,000. Source: OneKey MLS closed sales report, April 21 – October 7, 2026. Calculated by Educators Realty from 101 closed sales; information not guaranteed.

Closed Sales by Price Range

Under $600K
4
$600K–$699K
19
$700K–$799K
25
$800K–$899K
30
$900K–$1.09M
17
$1.1M and up
6

Source: OneKey MLS closed sales report, April 21 – October 7, 2026. Calculated by Educators Realty from 101 closed sales; information not guaranteed.

What This Market Means for Farmingdale Buyers

  • Expect competition on well-priced homes. The median September sale closed at 102.16% of list price, and about two-thirds of the homes in the six-month closed-sales report sold at or above their original asking price.
  • Be ready before you shop. With only 25 active listings and 1.79 months of supply, having a mortgage pre-approval in hand helps you act quickly when the right home appears.
  • Watch the price trend. The September median sold price of $725,000 was 15% lower than August’s. Reviewing recent comparable sales helps you judge whether a list price is in line with the market.
  • Consider every property type. Farmingdale sales range from co-op apartments under $450,000 to single-family homes above $1 million. Co-ops typically require board approval and may have different financing requirements, so ask about the process early.

What This Market Means for Farmingdale Sellers

  • Conditions favor sellers. RPR rates Farmingdale a seller’s market, and 1.79 months of supply keeps buyers competing for limited inventory.
  • Equity has grown. The median estimated value is up 14% over the past 12 months, so many owners have more equity than they may realize. A current home valuation can clarify your options.
  • Pricing still matters. The median sold price eased 15% in September, and days to contract rose. Homes priced in line with recent sales are the ones that draw the strongest offers.
  • Fall listings face less competition. Active listings fell 32.4% and new listings fell 37.5% month over month, so a well-prepared home can stand out this season.

Where Homes Sold: Price Ranges Across Farmingdale

The 20 recent sales featured below span Farmingdale’s full price range and a wide variety of property types:

  • Under $500,000 (4 homes): co-op apartments on Fulton Street, Elizabeth Street and Jervis Avenue, from $275,000 to $440,000.
  • $500,000–$699,999 (5 homes): a condo on Atlantic Avenue, a Cape on Ivy Street, a corner ranch on Bruce Lane, a renovated home on Jackson Street and a Stratford Green condo townhouse.
  • $700,000–$899,999 (6 homes): a renovated ranch, Capes in the Woodward Parkway area and Lenox Hills, a Dutch Colonial on West Street, a split-level and a 2009 Colonial — bracketing the September median sold price of $725,000.
  • $900,000–$1.19 million (3 homes): a Hi-Ranch in Clifton Commons, a legal two-family in the Incorporated Village and a home reconstructed in 2022.
  • $1.2 million and above (2 homes): a Contemporary Colonial in Melville Court at $1,325,000 and a renovated Lenox Hills home at $1,465,000.

The styles are just as varied: co-ops, a condo and a condo townhouse, ranches, Capes and Expanded Capes, a Dutch Colonial, a split-level, a Hi-Ranch, Colonials and a two-family home. These featured sales are a sample of recent activity, not a statistical summary — for market-wide figures, refer to the RPR data and closed-sales snapshot above.

Recently Sold in Farmingdale, NY

Below are 20 homes that recently sold in Farmingdale. Click any address, photo or button to view full property details on educatorsrealty.com.

21 Bruce Lane, Farmingdale, NY – recently sold homeSold

21 Bruce Lane, Farmingdale

$650,000

3 Beds  |  1 Baths

Corner ranch on an oversized 80′ x 100′ property on a cul-de-sac, with a formal dining room featuring a vaulted tray ceiling.

View Property Details

MLS# 1026038 • Listing courtesy of OneKey® MLS

11 Damin Drive, Farmingdale, NY – recently sold homeSold

11 Damin Drive, Farmingdale

$870,000

3 Beds  |  2 Baths

Split-level with a large living room, formal dining room with wainscoting, and an updated open kitchen with granite counters.

View Property Details

MLS# 1006734 • Listing courtesy of OneKey® MLS

Farmingdale Real Estate FAQs

Is Farmingdale, NY a buyer's or seller's market right now?

Based on September 2026 data from Realtors Property Resource (RPR), Farmingdale is classified as a seller's market, with 1.79 months of inventory and homes selling at a median of 102.16% of list price.

What is the median sold price of a home in Farmingdale, NY?

The median sold price for single-family homes, condos, townhouses and apartments in Farmingdale was $725,000 in September 2026, down 15% from the prior month, according to RPR. The median estimated property value was $826,760, up 14% over 12 months.

How fast are homes selling in Farmingdale, NY?

Homes that sold in September 2026 had a median of 29 days in RPR, up 26.1% month over month. New pending listings went under contract in a median of 28 days.

How many homes are for sale in Farmingdale, NY?

RPR reported 25 active listings in Farmingdale for September 2026, down 32.4% month over month, with 15 new listings coming to market during the month at a median list price of $740K.

What is the price per square foot in Farmingdale, NY?

Sold homes in Farmingdale had a median of $492 per square foot in September 2026, down 8.2% month over month. Active listings had a median of $495 per square foot.

Thinking About Buying or Selling in Farmingdale?

Educators Realty is a boutique brokerage based in Syosset serving buyers and sellers throughout Farmingdale, Nassau and Suffolk counties and Long Island. Whether you want to ask about one of the homes above, schedule a private showing, request more recent sales in your part of Farmingdale, refine your home search, or find out what your home could sell for in today’s market, we’re here to help.

Your AgentAlayna Camisa
Licensed Real Estate Salesperson
(516) 473-1156
Alayna@educatorsrealty.com
BrokerageEducators Realty
332 Jackson Ave, Syosset, NY 11791
(516) 517-2400
educatorsrealty.com
Call (516) 473-1156 Get a Home Valuation Search Farmingdale Homes

By:
Alayna Camisa
Licensed Real Estate Salesperson
(516) 473-1156
Alayna@educatorsrealty.com

Market statistics: Realtors Property Resource®, LLC, Farmingdale, NY Market Trends, September 2026 (SF + Condo/TH/Apt), retrieved October 15, 2026. Information is not guaranteed.

Listings courtesy of OneKey® MLS as distributed by MLS GRID. Based on information submitted to the MLS GRID as of 2026-10-15 at 8:17 am. All data is obtained from various sources and may not have been verified by broker or MLS GRID. All information should be independently reviewed and verified for accuracy. Properties may or may not be listed by the office/agent presenting the information.

Educators Realty, Inc., 332 Jackson Ave, Syosset, NY 11791. Equal Housing Opportunity. We are pledged to the letter and spirit of federal and New York State fair housing laws. NYS Fair Housing Notice.

Posted in Alayna's Blog
Oct. 15, 2026

Rockville Centre, NY Real Estate Market Report: October 2026

Your monthly look at Rockville Centre home prices, inventory and recent sales, using September 2026 data from Realtors Property Resource® (RPR) and OneKey® MLS.

If you are buying or selling a home in Rockville Centre this fall, the latest numbers describe a very tight market. RPR classifies Rockville Centre as a seller’s market, with just 1.86 months of inventory, and the typical home that sold in September closed at 102.86% of its list price — nearly 3% above asking. At the same time, the pace cooled a little from August: the median sold price eased to $1,050,000, fewer homes closed, and homes took longer to go under contract.

For buyers, that means competition is still real, but there may be slightly more breathing room than earlier this year. For sellers, it means demand remains strong, while pricing in line with recent sales matters more than it did over the summer. Below, we break down what the September 2026 data shows, add a closed-sales snapshot covering the past six months, and feature 20 recently sold Rockville Centre properties — from co-op apartments near the village center to Colonials and Tudors in Old Canterbury, New Canterbury, Strathmore and the Harvard section.

Rockville Centre Market at a Glance (September 2026)

Median Sold Price

$1,050,000

↓ 7.9% month over month

Months of Inventory

1.86

↓ 7% MoM • ↓ 23.1% over 12 months

Sold-to-List Price

102.86%

↓ 4.2% month over month

Median Days (Sold)

27

↑ 35% month over month

Median Est. Value

$997,000

↑ 1.5% MoM • ↑ 8.8% over 12 months

Homes Sold

18

↓ 21.7% month over month

Property types: SF + Condo/TH/Apt. Source: Realtors Property Resource®, LLC, report dated October 14, 2026.

Rockville Centre Market Type (RPR, September 2026)

▼    
     
Seller’s Market Balanced Buyer’s Market

Source: Realtors Property Resource®, LLC – September 2026, SF + Condo/TH/Apt.

What Changed From August to September 2026

Median sold price
▼ -7.9%
Homes sold
▼ -21.7%
Active listings
▼ -7.1%
New listings
▲ +8.3%
Months of supply
▼ -7%
Median days (sold)
▲ +35%
Sold $/sq ft
▼ -11.1%
Median est. value
▲ +1.5%

Increase    Decrease  •  Bar length shows size of change

Source: Realtors Property Resource®, LLC – September 2026, SF + Condo/TH/Apt.

What the September 2026 Numbers Mean for Rockville Centre

Home prices: a monthly dip within a strong 12-month gain

The median sold price in Rockville Centre was $1,050,000 in September, down 7.9% from August. With only 18 sales in the month, the mix of homes that happened to close can move the median noticeably. The broader picture is stronger: RPR’s median estimated property value stands at $997,000, up 1.5% month over month and up 8.8% over the past 12 months. RPR’s long-term value chart also shows Rockville Centre values sitting above Nassau County, New York State and national levels. For gauging equity, the 12-month value trend is usually a steadier guide than a single month of sales.

Median Price by Market Stage

New listings
$839K
Active
$938K
New pending
$839K
All pending
$849K
Sold
$1.05M

Source: Realtors Property Resource®, LLC – September 2026, SF + Condo/TH/Apt.

Inventory: very tight, and tighter than a year ago

Rockville Centre had 1.86 months of inventory in September, down 7% from August and down 23.1% from a year earlier. In practical terms, if no new homes came to market, current supply would sell out in less than two months — a level that strongly favors sellers. There were only 26 active listings (down 7.1%) with a median list price of $937.5K. On the supply side, 13 new listings came to market during the month (up 8.3%) at a median list price of $839K, down 14.6%.

Number of Properties by Market Stage

New listings
13
Active
26
New pending
10
All pending
36
Sold
18

Source: Realtors Property Resource®, LLC – September 2026, SF + Condo/TH/Apt.

Days on market: still quick, but slower than August

Homes that sold in September had a median of 27 days in RPR, up 35% from August. The slowdown is more visible earlier in the pipeline: new pending listings took a median of 54 days to go under contract (up 74.2%), and the broader pending pool sits at 50 days (up 78.6%). Active listings show a median of 46 days, down 19.3%. Well-priced homes are still moving, but buyers are taking a bit more time to decide.

Median Days in RPR by Market Stage

Sold
27 days
New pending
54 days
All pending
50 days
Active
46 days

Source: Realtors Property Resource®, LLC – September 2026, SF + Condo/TH/Apt.

Price per square foot and home size

Sold homes closed at a median of $499 per square foot in September, down 11.1% month over month. Active listings are asking a median of $511 per square foot for a median of 2,065 square feet, while new listings came in at $516 per square foot (up 6.6%) with a smaller median of 1,616 square feet. New pending listings carried a median of $510 per square foot and 1,798 square feet.

Median Price per Square Foot by Market Stage

New listings
$516
Active
$511
New pending
$510
All pending
$493
Sold
$499

Source: Realtors Property Resource®, LLC – September 2026, SF + Condo/TH/Apt.

Sales activity and pending contracts

A total of 18 homes sold in Rockville Centre in September, down 21.7% from August, for a total dollar volume of $20.04 million (down 31.1%). The pipeline also thinned: 10 new pending listings (down 33.3%) and 36 total pending listings (down 20%), with pending homes carrying a median list price of $849K. Because Rockville Centre is a single village with a relatively small number of monthly sales, these figures can swing more from month to month than county-wide numbers do.

Rockville Centre – September 2026, SF + Condo/TH/Apt. Source: Realtors Property Resource®, LLC. Changes are month over month.
Category # of Properties Median Price Median $/Sq Ft Median Days Total $ Volume
Sold 18 (↓21.7%) $1.05M sold (↓7.9%) $499 (↓11.1%) 27 (↑35%) $20.04M (↓31.1%)
Active 26 (↓7.1%) $938K list (↓4.5%) $511 (↑2%) 46 (↓19.3%) $27.94M (↓16.1%)
New Listings 13 (↑8.3%) $839K list (↓14.6%) $516 (↑6.6%) — $11.6M (↓6.8%)
New Pending 10 (↓33.3%) $839K list (↓16%) $510 (↑10.2%) 54 (↑74.2%) $11.57M (↓27.1%)
All Pending 36 (↓20%) $849K list (↓10.5%) $493 (↑3.1%) 50 (↑78.6%) $36.26M (↓18.8%)

Rockville Centre Closed Sales Snapshot (April 23 – October 13, 2026)

To look beyond a single month, we also analyzed a OneKey MLS closed-sales report covering 87 Rockville Centre sales that closed between April 23 and October 13, 2026. Over that period, the median sale price was $989,000 and the average was about $1.12 million, with prices ranging from $487,500 to $2.35 million. Homes spent a median of just 19 days on market, and the median price per square foot was $543. Measured against original list price, the median sale closed at 101.7% of the starting price, and 59 of the 87 homes sold at or above their original asking price.

These figures differ from RPR’s September numbers because they cover a longer window and a different mix of properties — none of the 87 sales in this report is a unit-numbered condo or co-op, while RPR’s figures include condos, townhouses and apartments. Both are accurate for their own scope. Together, they show a market where most homes sold quickly and at or above asking through the spring and summer, with a modest cooling in September.

Closed Sales

87

Median Sold Price

$989,000

Average Sold Price

$1,118,674

Median Days on Market

19

Median $/Sq Ft

$543

Sold prices ranged from $487,500 to $2,350,000. Source: OneKey MLS closed sales report, April 23 – October 13, 2026. Calculated by Educators Realty from 87 closed sales; information not guaranteed.

Closed Sales by Price Range

Under $700K
5
$700K–$899K
23
$900K–$1.19M
32
$1.2M–$1.49M
16
$1.5M and up
11

Source: OneKey MLS closed sales report, April 23 – October 13, 2026. Calculated by Educators Realty from 87 closed sales; information not guaranteed.

What This Market Means for Rockville Centre Buyers

  • Expect competition on well-priced homes. The median September sale closed at 102.86% of list price, and about two-thirds of the homes in the six-month closed-sales report sold at or above their original asking price.
  • Be ready before you shop. With only 26 active listings and 1.86 months of supply, having a mortgage pre-approval in hand helps you act quickly when the right home appears.
  • Use the slightly slower pace wisely. Longer days to contract this month may give you a little more time to tour, compare and line up inspections before committing.
  • Consider every property type. Rockville Centre sales range from co-op apartments under $400,000 to Colonials above $2 million. Co-ops typically require board approval and may have different financing requirements, so ask about the process early.

What This Market Means for Rockville Centre Sellers

  • Conditions strongly favor sellers. RPR rates Rockville Centre a seller’s market, and 1.86 months of supply keeps buyers competing for limited inventory.
  • Equity has grown. The median estimated value is up 8.8% over the past 12 months. A current home valuation can show what that means for your property.
  • Pricing still matters. Days to contract rose sharply in September, and the median sold price eased 7.9%. Homes priced in line with recent sales are the ones that draw strong offers.
  • Fall listings face little competition. With just 26 active listings, a well-prepared home can stand out this season.

Where Homes Sold: Price Ranges Across Rockville Centre

The 20 recent sales featured below cover Rockville Centre’s full price spectrum and a wide range of property types:

  • Under $500,000 (4 homes): co-op and apartment units on Lincoln Avenue, South Park Avenue, Lenox Road and North Village Avenue, from $285,000 to $439,000.
  • $500,000–$799,999 (4 homes): a Colonial-style home on Langdon Boulevard, a Park Lane Condominium unit, a two-story Colonial on Raymond Street and a two-family home on Water Street.
  • $800,000–$999,999 (4 homes): a Cape on Lakeview Avenue, a Colonial on Raymond Street, a split-level on Driscoll Avenue and a ranch in New Canterbury.
  • $1 million–$1.99 million (5 homes): an expanded Cape on Dorset Lane, a Victorian on Lee Avenue, new construction on Woodfield Road, and Tudors in Strathmore and the Harvard section — around the September median sold price of $1,050,000.
  • $2 million and above (3 homes): Colonials on Andover Road, Demott Avenue and Whitehall Road, from $2,080,000 to $2,350,000.

Architectural variety is also on display: Colonials of several types, including Center Hall and Georgian Revival, Tudors, Capes, a ranch, a split-level, a Victorian, a two-family home, new construction, and co-op and condominium apartments. These featured sales are a sample of recent activity, not a statistical summary — for market-wide figures, refer to the RPR data and closed-sales snapshot above.

Recently Sold in Rockville Centre, NY

Below are 20 homes that recently sold in Rockville Centre. Click any address, photo or button to view full property details on educatorsrealty.com.

Rockville Centre Real Estate FAQs

Is Rockville Centre, NY a buyer's or seller's market right now?

Based on September 2026 data from Realtors Property Resource (RPR), Rockville Centre is classified as a seller's market, with 1.86 months of inventory and homes selling at a median of 102.86% of list price.

What is the median sold price of a home in Rockville Centre, NY?

The median sold price for single-family homes, condos, townhouses and apartments in Rockville Centre was $1,050,000 in September 2026, down 7.9% from the prior month, according to RPR. The median estimated property value was $997,000, up 8.8% over 12 months.

How fast are homes selling in Rockville Centre, NY?

Homes that sold in September 2026 had a median of 27 days in RPR, up 35% month over month. New pending listings took a median of 54 days to go under contract, and active listings showed a median of 46 days.

How many homes are for sale in Rockville Centre, NY?

RPR reported 26 active listings in Rockville Centre for September 2026, down 7.1% month over month, with 13 new listings coming to market during the month at a median list price of $839K.

What is the price per square foot in Rockville Centre, NY?

Sold homes in Rockville Centre had a median of $499 per square foot in September 2026, down 11.1% month over month. Active listings had a median of $511 per square foot.

Thinking About Buying or Selling in Rockville Centre?

Educators Realty is a boutique brokerage based in Syosset serving buyers and sellers throughout Rockville Centre, Nassau County and Long Island. Whether you want to ask about one of the homes above, schedule a private showing, request more recent sales in your section of Rockville Centre, refine your home search, or find out what your home could sell for in today’s market, we’re here to help.

Your AgentPatrick Allgier
Licensed Real Estate Salesperson
(516) 376-5330
pallgier@educatorsrealty.com
BrokerageEducators Realty
332 Jackson Ave, Syosset, NY 11791
(516) 517-2400
educatorsrealty.com
Call (516) 376-5330 Get a Home Valuation Search Rockville Centre Homes

By:
Patrick Allgier
Licensed Real Estate Salesperson
(516) 376-5330
pallgier@educatorsrealty.com

Market statistics: Realtors Property Resource®, LLC, Rockville Centre, NY Market Trends, September 2026 (SF + Condo/TH/Apt), retrieved October 14, 2026. Information is not guaranteed.

Listings courtesy of OneKey® MLS as distributed by MLS GRID. Based on information submitted to the MLS GRID as of 2026-10-15 at 7:57 am. All data is obtained from various sources and may not have been verified by broker or MLS GRID. All information should be independently reviewed and verified for accuracy. Properties may or may not be listed by the office/agent presenting the information.

Educators Realty, Inc., 332 Jackson Ave, Syosset, NY 11791. Equal Housing Opportunity. We are pledged to the letter and spirit of federal and New York State fair housing laws. NYS Fair Housing Notice.

Oct. 15, 2026

Long Beach, NY Real Estate Market Report: October 2026

Your monthly look at Long Beach home prices, inventory and recent sales, using September 2026 data from Realtors Property Resource® (RPR) and OneKey® MLS.

If you are buying or selling a home in Long Beach this fall, the September numbers show a market that is still active but sending mixed signals. RPR classifies Long Beach as a seller’s market, and the median sold price rose to $850,000, up 9.6% from August. At the same time, inventory sits at 5.37 months of supply — down sharply from last month, but still a comfortable supply for buyers — and the typical home sold for 97.75% of its list price, slightly below asking.

For buyers, that means more selection and more room to negotiate than in many nearby communities. For sellers, it means demand is there, but price and presentation decide how quickly a home sells. Below, we break down what the September 2026 data shows, add a six-month closed-sales snapshot, and feature 20 recently sold Long Beach homes — from oceanfront co-ops on Shore Road and West Broadway to houses in the West End, the East End and the Canals section.

Long Beach Market at a Glance (September 2026)

Median Sold Price

$850,000

↑ 9.6% month over month

Months of Inventory

5.37

↓ 20.1% MoM • ↓ 15.4% over 12 months

Sold-to-List Price

97.75%

↓ 1.4% month over month

Median Days (Sold)

35

↑ 6.1% month over month

Median Est. Value

$893,000

↑ 0.3% MoM • ↑ 5.3% over 12 months

Homes Sold

15

↑ 25% month over month

Property types: SF + Condo/TH/Apt. Source: Realtors Property Resource®, LLC, report dated October 14, 2026.

Long Beach Market Type (RPR, September 2026)

▼    
     
Seller’s Market Balanced Buyer’s Market

Source: Realtors Property Resource®, LLC – September 2026, SF + Condo/TH/Apt.

What Changed From August to September 2026

Median sold price
▲ +9.6%
Homes sold
▲ +25%
Active listings
▼ -15.7%
New listings
▼ -48.6%
Months of supply
▼ -20.1%
Median days (sold)
▲ +6.1%
Sold $/sq ft
▲ +9.3%
Median est. value
▲ +0.3%

Increase    Decrease  •  Bar length shows size of change

Source: Realtors Property Resource®, LLC – September 2026, SF + Condo/TH/Apt.

What the September 2026 Numbers Mean for Long Beach

Home prices: a monthly gain within a steady upward trend

The median sold price in Long Beach was $850,000 in September, up 9.6% from August. Keep in mind that only 15 homes sold during the month, so a few higher-priced closings can move the median noticeably. RPR’s median estimated property value, which covers the broader housing stock, stands at $893,000 — up 0.3% month over month and up 5.3% over the past 12 months. RPR’s long-term value chart also shows Long Beach values tracking close to Nassau County and well above New York State and national levels. For gauging equity, the 12-month value trend is usually a steadier guide than a single month of sales.

Median Price by Market Stage

New listings
$800K
Active
$1.11M
New pending
$999K
All pending
$1.10M
Sold
$850K

Source: Realtors Property Resource®, LLC – September 2026, SF + Condo/TH/Apt.

Inventory: tighter than last month, but buyers still have choices

Long Beach had 5.37 months of inventory in September, down 20.1% from August and down 15.4% from a year earlier. In practical terms, if no new homes came to market, current supply would take a little over five months to sell. There were 102 active listings (down 15.7%) with a median list price of $1.11 million. New supply slowed sharply: only 19 new listings came to market in September, down 48.6%, at a median list price of $800K (down 19.6%).

Number of Properties by Market Stage

New listings
19
Active
102
New pending
20
All pending
51
Sold
15

Source: Realtors Property Resource®, LLC – September 2026, SF + Condo/TH/Apt.

Days on market: closings steady, contracts taking longer

Homes that sold in September had a median of 35 days in RPR, up 6.1% from August. Earlier in the pipeline, the timeline stretched more noticeably: new pending listings took a median of 54 days to go under contract (up 54.3%), and the overall pending pool sits at 56 days (up 64.7%). Active listings show a median of 70 days, down 13.6% month over month. Buyers are still committing, but many are taking their time before they do.

Median Days in RPR by Market Stage

Sold
35 days
New pending
54 days
All pending
56 days
Active
70 days

Source: Realtors Property Resource®, LLC – September 2026, SF + Condo/TH/Apt.

Price per square foot and home size

Sold homes closed at a median of $609 per square foot in September, up 9.3% from August. Active listings are asking a median of $657 per square foot for a median of 1,606 square feet, while new listings came in at $664 per square foot with a smaller median of 1,277 square feet. New pending listings averaged larger homes — a median of 2,028 square feet at $589 per square foot.

Median Price per Square Foot by Market Stage

New listings
$664
Active
$657
New pending
$589
All pending
$613
Sold
$609

Source: Realtors Property Resource®, LLC – September 2026, SF + Condo/TH/Apt.

Sales activity and pending contracts

A total of 15 homes sold in Long Beach in September, up 25% from August, for a total dollar volume of $12.91 million (up 23.4%). The pipeline points to more closings ahead: 20 new pending listings (up 5.3%) and 51 total pending listings (up 8.5%), with pending homes carrying a median list price of $1.1 million. Because Long Beach is a single city with a relatively small number of monthly sales, expect these figures to swing more from month to month than county-wide numbers do.

Long Beach – September 2026, SF + Condo/TH/Apt. Source: Realtors Property Resource®, LLC. Changes are month over month.
Category # of Properties Median Price Median $/Sq Ft Median Days Total $ Volume
Sold 15 (↑25%) $850K sold (↑9.6%) $609 (↑9.3%) 35 (↑6.1%) $12.91M (↑23.4%)
Active 102 (↓15.7%) $1.11M list (↑0.9%) $657 (↑1.1%) 70 (↓13.6%) $135M (↓15.5%)
New Listings 19 (↓48.6%) $800K list (↓19.6%) $664 (↓0.9%) — $20.6M (↓56.1%)
New Pending 20 (↑5.3%) $999K list (↓2.5%) $589 (↓3.9%) 54 (↑54.3%) $24.48M (↑1.2%)
All Pending 51 (↑8.5%) $1.10M list (↑9.6%) $613 (0%) 56 (↑64.7%) $67.73M (↑17.5%)

Long Beach Closed Sales Snapshot (April 23 – October 7, 2026)

To give a fuller picture than one month of sales allows, we also analyzed a OneKey MLS closed-sales report covering 71 Long Beach sales that closed between April 23 and October 7, 2026. Over that period, the median sale price was $920,000 and the average was about $1.08 million, with prices ranging from $530,000 to $2.6 million. Homes spent a median of 35 days on market, and the median price per square foot was $581 (based on the 68 sales that reported living area). Measured against original list price, the median sale closed at 96.8% of the starting price, and 24 of the 71 sold at or above their original asking price.

These figures differ from RPR’s September numbers because they cover a longer window and a different mix of properties — none of the 71 sales in this report is a unit-numbered condo or co-op, while RPR’s figures include condos, townhouses and apartments. Both are accurate for their own scope. Together they suggest that well-priced homes in Long Beach sell in about a month, while homes that start too high often need a price adjustment before they sell.

Closed Sales

71

Median Sold Price

$920,000

Average Sold Price

$1,077,708

Median Days on Market

35

Median $/Sq Ft

$581

Sold prices ranged from $530,000 to $2,600,000. Source: OneKey MLS closed sales report, April 23 – October 7, 2026. Calculated by Educators Realty from 71 closed sales; information not guaranteed.

Closed Sales by Price Range

Under $700K
11
$700K–$899K
23
$900K–$1.19M
15
$1.2M–$1.49M
12
$1.5M and up
10

Source: OneKey MLS closed sales report, April 23 – October 7, 2026. Calculated by Educators Realty from 71 closed sales; information not guaranteed.

What This Market Means for Long Beach Buyers

  • You may have room to negotiate. The median September sale closed at 97.75% of list price, and the six-month closed-sales report shows a median of 96.8% of original list price. Not every seller is getting full asking price.
  • Compare list prices with recent sales. Active listings carry a $1.11 million median list price, while September’s median sold price was $850,000. Reviewing comparable sales before you make an offer helps you judge where a home is priced.
  • New listings are thin right now. Only 19 new listings came to market in September, down 48.6%. Have your mortgage pre-approval ready so you can act when the right property appears.
  • Choose the property type that fits your plans. Long Beach sales range from co-op apartments and condos to single-family and two-family homes. Co-ops typically require board approval and may have different financing requirements, so ask about the process early.

What This Market Means for Long Beach Sellers

  • Prices are holding up. The median sold price rose 9.6% in September, and RPR’s median estimated value is up 5.3% over the past 12 months. Many owners have more equity than they may realize.
  • Pricing right from the start matters. With 5.37 months of supply and homes closing a little under list price, buyers have choices. Homes priced in line with recent sales are the ones that move.
  • Expect a longer path to contract. New pending listings took a median of 54 days to go under contract, up 54.3%. Plan your timeline with that in mind.
  • Fall listings face less new competition. New listings fell 48.6% and active listings fell 15.7% month over month, so a well-prepared home can stand out this season.

Where Homes Sold: Price Ranges Across Long Beach

The 20 recent sales featured below cover Long Beach’s full price spectrum and a wide mix of property types, from the oceanfront buildings along Shore Road and West Broadway to the West End, the East End and the Canals section:

  • Under $500,000 (5 homes): co-ops and condos on West Broadway, Shore Road and Riverside Boulevard, from $350,000 to $499,000.
  • $500,000–$799,999 (3 homes): a converted Junior 4 on Shore Road, a renovated West End ranch, and a 3-bedroom beach house on East Market Street.
  • $800,000–$999,999 (4 homes): an oceanfront unit on Shore Road, a West End raised ranch, a split on East State Street and a Cape in the Canals section — right around the September median sold price of $850,000.
  • $1 million–$1.99 million (6 homes): an East End two-family, a West End home between the beach and bay, an oceanfront townhouse, an East End contemporary, a bayfront condo and a FEMA-compliant home on Michigan Street.
  • $2 million and above (2 homes): a new-construction contemporary on East Olive Street at $2,225,000 and an oceanfront residence on West Broadway at $4,600,000.

The styles are just as varied: co-op and condo apartments, a townhouse, ranches and a raised ranch, a split, a Cape, a two-family home, contemporary designs and new construction. These featured sales are a sample of recent activity, not a statistical summary — for market-wide figures, refer to the RPR data and closed-sales snapshot above.

Recently Sold in Long Beach, NY

Below are 20 homes that recently sold in Long Beach. Click any address, photo or button to view full property details on educatorsrealty.com.

Long Beach Real Estate FAQs

Is Long Beach, NY a buyer's or seller's market right now?

Based on September 2026 data from Realtors Property Resource (RPR), Long Beach is classified as a seller's market. Inventory was 5.37 months of supply, down 20.1% from the prior month, and homes sold at a median of 97.75% of list price.

What is the median sold price of a home in Long Beach, NY?

The median sold price for single-family homes, condos, townhouses and apartments in Long Beach was $850,000 in September 2026, up 9.6% from the prior month, according to RPR. The median estimated property value was $893,000, up 5.3% over 12 months.

How fast are homes selling in Long Beach, NY?

Homes that sold in September 2026 had a median of 35 days in RPR, up 6.1% month over month. New pending listings took a median of 54 days to go under contract, and active listings showed a median of 70 days.

How many homes are for sale in Long Beach, NY?

RPR reported 102 active listings in Long Beach for September 2026, down 15.7% month over month, with 19 new listings coming to market during the month at a median list price of $800K.

What is the price per square foot in Long Beach, NY?

Sold homes in Long Beach had a median of $609 per square foot in September 2026, up 9.3% month over month. Active listings had a median of $657 per square foot.

Thinking About Buying or Selling in Long Beach?

Educators Realty is a boutique brokerage based in Syosset serving buyers and sellers throughout Long Beach, Nassau County and Long Island. Whether you want to ask about one of the homes above, schedule a private showing, request more recent sales in your part of Long Beach, refine your home search, or find out what your home could sell for in today’s market, we’re here to help.

Your AgentDylan Jensen
Licensed Real Estate Salesperson
(516) 512-1872
dylan@educatorsrealty.com
BrokerageEducators Realty
332 Jackson Ave, Syosset, NY 11791
(516) 517-2400
educatorsrealty.com
Call (516) 512-1872 Get a Home Valuation Search Long Beach Homes

By:
Dylan Jensen
Licensed Real Estate Salesperson
(516) 512-1872
dylan@educatorsrealty.com

Market statistics: Realtors Property Resource®, LLC, Long Beach, NY Market Trends, September 2026 (SF + Condo/TH/Apt), retrieved October 14, 2026. Information is not guaranteed.

Listings courtesy of OneKey® MLS as distributed by MLS GRID. Based on information submitted to the MLS GRID as of 2026-10-15 at 7:37 am. All data is obtained from various sources and may not have been verified by broker or MLS GRID. All information should be independently reviewed and verified for accuracy. Properties may or may not be listed by the office/agent presenting the information.

Educators Realty, Inc., 332 Jackson Ave, Syosset, NY 11791. Equal Housing Opportunity. We are pledged to the letter and spirit of federal and New York State fair housing laws. NYS Fair Housing Notice.

Oct. 14, 2026

Syosset, NY Real Estate Market Report: October 2026

Syosset, NY Real Estate Market Report: October 2026

Your monthly look at Syosset home prices, inventory and recent sales, using September 2026 data from Realtors Property Resource® (RPR) and OneKey® MLS.

If you are buying or selling a home in Syosset this fall, the September numbers point to a market that is still competitive but quieter than it was over the summer. RPR continues to classify Syosset as a seller’s market: there were just 3.25 months of inventory, homes that sold closed at a median of 100.85% of their list price, and the typical sale went under contract in 26 days — faster than in August. At the same time, fewer homes closed, the median sold price eased to $1,230,000, and the number of new contracts signed during the month dropped sharply.

For buyers, that mix means well-priced homes still move quickly, but there is a little less frenzy than at the summer peak. For sellers, it means demand is there for homes priced in line with recent sales. Below, we break down what the September 2026 data shows, add a six-month look at closed sales from OneKey® MLS, and feature 20 recently sold homes from across Syosset — from Birchwood and Campus Estates to Hidden Ridge, North Syosset and the Split Rock Road area.

Syosset Market at a Glance (September 2026)

Median Sold Price

$1,230,000

↓ 12.8% month over month

Months of Inventory

3.25

↓ 5.8% MoM • ↑ 8.3% over 12 months

Sold-to-List Price

100.85%

↑ 3.1% month over month

Median Days (Sold)

26

↓ 21.2% month over month

Median Est. Value

$1,321,440

↑ 0.5% MoM • ↑ 14% over 12 months

Homes Sold

27

↓ 25% month over month

Property types: SF + Condo/TH/Apt. Source: Realtors Property Resource®, LLC, report dated October 14, 2026.

Syosset Market Type (RPR, September 2026)

▼    
     
Seller’s Market Balanced Buyer’s Market

Source: Realtors Property Resource®, LLC – September 2026, SF + Condo/TH/Apt.

What Changed From August to September 2026

Median sold price
▼ -12.8%
Homes sold
▼ -25%
Active listings
▼ -5.8%
New listings
▼ -4%
Months of supply
▼ -5.8%
Median days (sold)
▼ -21.2%
Sold $/sq ft
▲ +18.4%
Median est. value
▲ +0.5%

Increase    Decrease  •  Bar length shows size of change

Source: Realtors Property Resource®, LLC – September 2026, SF + Condo/TH/Apt.

What the September 2026 Numbers Mean for Syosset

Home prices: a monthly dip, a strong 12-month trend

The median sold price in Syosset was $1,230,000 in September, down 12.8% from August. A single month in one town reflects a small number of closings, so it helps to look at the wider picture: RPR’s median estimated property value for Syosset is $1,321,440, up 0.5% month over month and up 14% over the past 12 months. RPR’s long-term value chart also shows Syosset sitting well above Nassau County, New York State and national levels. In short, the monthly median dipped because of the mix of homes that happened to close, while overall values have continued to climb.

Median Price by Market Stage

New listings
$1.47M
Active
$1.99M
New pending
$1.22M
All pending
$1.53M
Sold
$1.23M

Source: Realtors Property Resource®, LLC – September 2026, SF + Condo/TH/Apt.

Inventory: tight, and a little tighter than last month

Syosset had 3.25 months of inventory in September, down 5.8% from August but up 8.3% from a year earlier. If no new homes came to market, today’s supply would sell out in a little over three months — a level usually associated with sellers holding the advantage. There were 65 active listings (down 5.8%) with a median list price of $1.99M, unchanged from August. Only 24 new listings came to market during the month (down 4%), at a median list price of $1.47M, down 18.4%.

Number of Properties by Market Stage

New listings
24
Active
65
New pending
13
All pending
57
Sold
27

Source: Realtors Property Resource®, LLC – September 2026, SF + Condo/TH/Apt.

Days on market: sold homes moved faster

Homes that sold in September spent a median of 26 days in RPR, down 21.2% from August. Earlier in the pipeline, the picture is more mixed: new pending listings took a median of 51 days to go under contract (up 4.1%), and the full pending pool sits at 34 days (up 36%). Active listings show a median of 56 days, down 8.2%. Homes that are priced right are still selling quickly, while higher-priced listings tend to take longer.

Median Days in RPR by Market Stage

Sold
26 days
New pending
51 days
All pending
34 days
Active
56 days

Source: Realtors Property Resource®, LLC – September 2026, SF + Condo/TH/Apt.

Price per square foot and home size

Sold homes closed at a median of $690 per square foot, up 18.4% from August. That rise, alongside a lower median sold price, suggests September’s closings leaned toward smaller homes selling at strong per-foot values. Active listings are asking a median of $613 per square foot for a median of 3,127 square feet, while new listings came in at $621 per square foot and a median of 2,585 square feet.

Median Price per Square Foot by Market Stage

New listings
$621
Active
$613
New pending
$563
All pending
$603
Sold
$690

Source: Realtors Property Resource®, LLC – September 2026, SF + Condo/TH/Apt.

Sales activity and pending contracts

27 homes sold in Syosset in September, down 25% from August, for a total dollar volume of $45.14 million (down 35.2%). The forward-looking numbers are worth watching: 13 new pending listings were recorded during the month, down 48%, and the total pending pool fell 20.8% to 57 homes with a median list price of $1.53M. That pipeline still points to a steady run of closings this fall, though at a slower pace than the summer. RPR did not report public-record sales data for Syosset this month because of limited activity in that dataset.

Syosset – September 2026, SF + Condo/TH/Apt. Source: Realtors Property Resource®, LLC. Changes are month over month.
Category # of Properties Median Price Median $/Sq Ft Median Days Total $ Volume
Sold 27 (↓25%) $1.23M sold (↓12.8%) $690 (↑18.4%) 26 (↓21.2%) $45.14M (↓35.2%)
Active 65 (↓5.8%) $1.99M list (0%) $613 (↑1.3%) 56 (↓8.2%) $151.6M (↓4.2%)
New Listings 24 (↓4%) $1.47M list (↓18.4%) $621 (↑3.2%) — $46.3M (↓1.9%)
New Pending 13 (↓48%) $1.22M list (↓6.1%) $563 (↓12.4%) 51 (↑4.1%) $24.71M (↓45.1%)
All Pending 57 (↓20.8%) $1.53M list (↑9.4%) $603 (↓5.2%) 34 (↑36%) $107.8M (↓17.1%)

Syosset Closed Sales Snapshot (April–October 2026)

To give a fuller picture than one month allows, we also looked at 124 Syosset closed sales recorded in OneKey® MLS between April 22 and October 13, 2026. Over that stretch the median sold price was $1,262,400, homes spent a median of 21 days on market, and the median sale closed right at 100% of list price — with 70 of the 124 sales closing at or above list. The middle of the market is wide: 78 sales landed between $1 million and $1.99 million, while 31 closed under $1 million and 15 closed at $2 million or more.

These figures differ slightly from RPR’s because they cover six months of closings instead of a single month, and RPR applies its own filters. Both are accurate for their own scope. For sellers, the takeaway is that well-priced homes have been selling in about three weeks at or near asking. For buyers, it shows a broad range of price points has traded hands this year.

Closed Sales

124

Median Sold Price

$1,262,400

Average Sold Price

$1,428,900

Median Days on Market

21

Median $/Sq Ft

$606

Median Sold-to-List

100.0%

Sold prices ranged from $700,000 to $4,488,000. Source: OneKey MLS Listing Strategy report, closed sales April 22 – October 13, 2026. Calculated by Educators Realty from 124 closed sales; information not guaranteed.

Closed Sales by Price Range

Under $1M
31
$1M–$1.24M
27
$1.25M–$1.49M
27
$1.5M–$1.99M
24
$2M–$2.99M
10
$3M and up
5

Source: OneKey MLS Listing Strategy report, closed sales April 22 – October 13, 2026. Calculated by Educators Realty from 124 closed sales; information not guaranteed.

What This Market Means for Syosset Buyers

  • Expect to compete for well-priced homes. Sold homes closed at a median of 100.85% of list price in September, and over the past six months most sales closed at or above asking.
  • Be ready to move. The median sold home went under contract in 26 days, so have your mortgage pre-approval and inspection plans lined up before you start touring.
  • Look beyond the median list price. Active listings carry a $1.99M median list price, while the median sold price was $1.23M. Higher-priced listings make up much of what’s for sale, so reviewing recent comparable sales is essential before you make an offer.
  • Watch for longer-listed homes. Active listings show a median of 56 days on market. Homes that have sat longer may leave more room to negotiate.

What This Market Means for Syosset Sellers

  • Conditions still favor sellers. RPR rates Syosset a seller’s market, with 3.25 months of supply and only 24 new listings in September.
  • Equity has grown. The median estimated value is up 14% over the past 12 months, to $1,321,440. A current home valuation can show where your home stands.
  • Pricing drives speed. Sold homes went under contract in a median of 26 days, while active listings show 56 days. The gap usually comes down to price relative to recent sales.
  • Fall listings face less competition. Active and new listing counts both fell month over month, so a well-prepared home can stand out this season.

Where Homes Sold: Price Ranges Across Syosset

The 20 recent sales featured below cover Syosset’s full price range and many of its sections, including Birchwood, Campus Estates, Hidden Ridge, North Syosset, Clearview Village and the Split Rock Road and Muttontown areas:

  • Under $1 million (5 homes): from $800,000 on Whitney Avenue to $975,000 in the Clearview Village section, including a Ranch on Arbor Road, an expanded Cape on Texas Court and a Glade model in Hidden Ridge.
  • $1 million–$1.49 million (6 homes): a high Ranch, a Campus Estates contemporary, a North Syosset Colonial, a Birchwood expanded split, a legal two-family home and a Hidden Ridge end-unit condo.
  • $1.5 million–$1.99 million (4 homes): an expanded split-level, new construction on Raynham Drive, a sprawling ranch on a 1.06-acre corner lot and a Hamptons-style Colonial with a pond view.
  • $2 million–$2.99 million (2 homes): a home on Split Rock Road and an expanded center-hall Colonial on two acres in Laurel Hollow.
  • $3 million and above (3 homes): a brick and stucco Colonial on two acres, an expanded home in Coves Run and a 6,600-square-foot estate in Muttontown at $4,488,000.

The architectural mix is broad: Ranches, high Ranches, splits, Colonials, contemporaries, a Cape, condos and new construction. These featured sales are a sample of recent activity, not a statistical summary — for town-wide figures, refer to the RPR data and Closed Sales Snapshot above.

Recently Sold in Syosset, NY

Below are 20 homes that recently sold in Syosset. Click any address, photo or button to view full property details on educatorsrealty.com.

Syosset Real Estate FAQs

Is Syosset, NY a buyer's or seller's market right now?

Based on September 2026 data from Realtors Property Resource (RPR), Syosset is classified as a seller's market, with 3.25 months of inventory and sold homes closing at a median of 100.85% of list price.

What is the median sold price of a home in Syosset?

The median sold price for single-family homes, condos, townhouses and apartments in Syosset was $1,230,000 in September 2026, down 12.8% from the prior month, according to RPR. The median estimated property value was $1,321,440, up 14% over 12 months.

How fast are homes selling in Syosset?

Homes that sold in September 2026 had a median of 26 days in RPR, down 21.2% month over month. Active listings showed a median of 56 days.

How many homes are for sale in Syosset?

RPR reported 65 active listings in Syosset for September 2026, down 5.8% month over month, with 24 new listings coming to market during the month.

What is the price per square foot in Syosset?

Sold homes in September 2026 had a median of $690 per square foot, up 18.4% month over month. Active listings had a median of $613 per square foot.

Thinking About Buying or Selling in Syosset?

Educators Realty is a boutique brokerage based right here in Syosset, serving buyers and sellers throughout Nassau County and Long Island. Whether you want to ask about one of the homes above, schedule a private showing, see more recent sales in your section of Syosset, refine your home search, or find out what your home could sell for in today’s market, we’re here to help.

Your AgentChristopher Robson
Licensed Real Estate Broker
(516) 459-9564
chris@educatorsrealty.com
BrokerageEducators Realty
332 Jackson Ave, Syosset, NY 11791
(516) 517-2400
educatorsrealty.com
Call (516) 459-9564 Get a Home Valuation Search Syosset Homes

By:
Christopher Robson
Licensed Real Estate Broker
Molloy University Real Estate Faculty
(516) 459-9564
chris@educatorsrealty.com

Market statistics: Realtors Property Resource®, LLC, Syosset, NY Market Trends, September 2026 (SF + Condo/TH/Apt), retrieved October 14, 2026. Information is not guaranteed.

Listings courtesy of OneKey® MLS as distributed by MLS GRID. Based on information submitted to the MLS GRID as of 2026-10-15 at 8:58 pm. All data is obtained from various sources and may not have been verified by broker or MLS GRID. All information should be independently reviewed and verified for accuracy. Properties may or may not be listed by the office/agent presenting the information.

Educators Realty, Inc., 332 Jackson Ave, Syosset, NY 11791. Equal Housing Opportunity. We are pledged to the letter and spirit of federal and New York State fair housing laws. NYS Fair Housing Notice.